

Technically Speaking
Monthly Analysis: Livestock Markets
Live Cattle: The October contract closed at $143.20, down $2.725 on the monthly chart. The major (long-term) trend remains down with support between $141.95 and $137.40. These prices mark the 33% and 38.2% retracement levels of previous uptrend from $79.975 (March 2009 low) through $172.75 (November 2014 high). Monthly stochastics remain bearish but nearing the oversold level of 20%.
P[L1] D[0x0] M[300x250] OOP[F] ADUNIT[] T[]
Feeder Cattle: The October contract closed at $197.875, down $12.85 on the monthly chart. The major (long-term) trend remains down with support between $192.375 and $184.525, prices that mark the 33% and 38.2% retracement level of the previous uptrend from $85.50 (December 2008 low) through $245.75 (October 2014 high). Monthly stochastics are bearish and still well above the oversold level of 20%. This would indicate the market could see continued selling over the coming months.
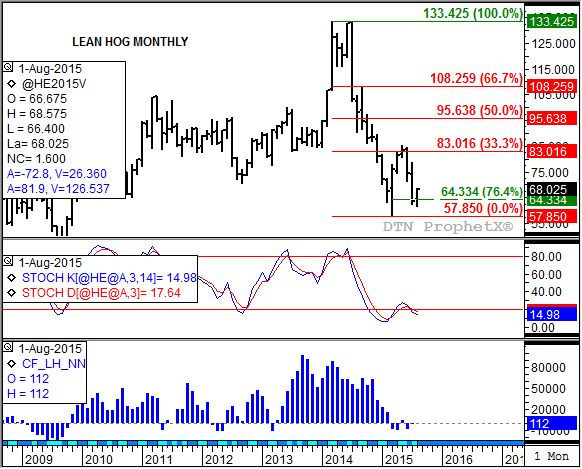
Lean Hogs: The October contract closed at $68.025, up $4.30 on the monthly chart. The market remains in a major (long-term) 5-wave uptrend pattern with Wave 2 nearing an end. The October contract closed back above support near $64.35, a price that marks the 76.4% retracement level of Wave 1 from $57.85 (March 2015) to $85.325 (May 2015). Monthly stochastics neutral-to-bullish below the oversold level of 20% and could establish a secondary (confirming) bullish crossover in the coming months.
Corn (Cash): The DTN National Corn Index (NCI.X, national average cash price) closed at $3.40, down 3 cents for the month. The NCI.X remains in a major (long-term) 5-wave uptrend pattern, holding support between $3.44 and $3.23 during August. These prices mark the 50% and 67% retracement levels of the rally from $2.81 (October 2014) through $4.06 (July 2015). Monthly stochastics remain bullish.
Soybean meal: The most active December contract closed at $310.20, down $13.70 on the continuous monthly chart. The monthly soybean meal chart (most active contract) continues to show a complex series of patterns. However, given that June saw a bullish key reversal established in conjunction with a bullish crossover by monthly stochastics below the oversold level of 20% the major (long-term) trend would still be classified as up. Confirmation of Wave 3 (of a 5-wave uptrend) won't occur until the most active contract moves above the Wave 1 high of $417.60. This is also a test of resistance at $418.40, the 50% retracement level of the previous major downtrend from $541.80 through the low of $295.10. Support is at the low of $295.30 (June 2015).
To track my thoughts on the markets throughout the day, follow me on Twitter: www.twitter.com\DarinNewsom


Comments
To comment, please Log In or Join our Community .