

Fundamentally Speaking
Possible 2015 U.S. Trend Yield for Corn
U.S. corn production is the product of total harvested acreage times the national yield.
It is very early in the season to be prognosticating potential output but never too early to tackle this subject.
The USDA will release the prospective plantings report this Tuesday and for harvested acreage one can take the long-term average harvested planted ratio of 92% times that intentions figure to arrive at a prospective harvested area number.
As for yield a little trickier though most yield forecasts including the initial ones furnished by the USDA involve some sort of trend calculation.
P[L1] D[0x0] M[300x250] OOP[F] ADUNIT[] T[]
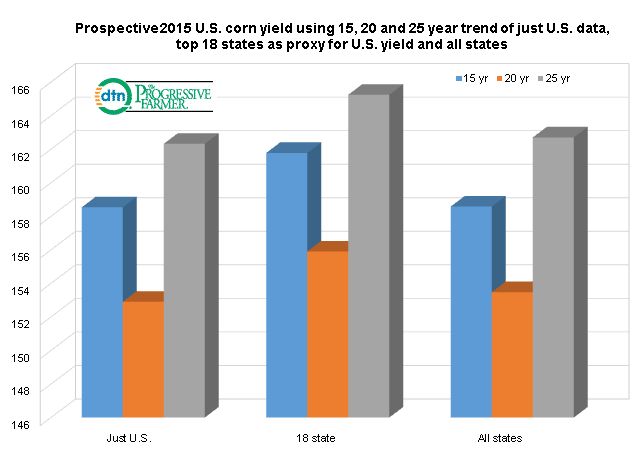
This is what we have done three different ways all involving the 15, 20 and 25 year trends.
First we used just the U.S. final corn yields and then we derived an 18 state yield incorporating the top producing states that the USDA reports on as far as crop progress and condition during the growing season and used that 18 state yield to arrive at a total U.S. yield using the average 18 state yield as a percent of the national yield.
Finally we calculated the 15, 20 and 25 year trend for all 48 states in the continental U.S. (CONUS) and derived a national yield using each states percent of national corn production over the past 15, 20 and 25 years.
Using just the U.S. data the 15, 20 and 25 year trend yields were 158.5, 152.9 and 162.3 bushels per acre (bpa) respectively.
Using the weighed top 18 state yield as a proxy for the U.S. yield resulted in a 161.8, 155.9 and 165.2 bpa estimates.
Finally using all 48 CONUS states resulted in a 15 year trend of 158.6 bpa, 153.5 bpa for the 20 year trend and 162.7 bpa for the 25 year trend.
Interestingly the 20 year trend yield was lower than the 15 and 25 year trends for all three separate calculations.
We assume this was based on the 20 year containing some very bad years bit not including some excellent yielding years such as 1992 and 1994.
We note that the average for all nine calculations is 159.0 bpa and even the highest estimate of 165.2 is below the USDA yield projection made at their February Outlook Forum of 166.8 bpa.
(KA)
Copyright 2015 DTN/The Progressive Farmer. All rights reserved.