

Technically Speaking Blog
Monthly Analysis: Grain Markets
Corn (Cash): The DTN National Corn Index (NCI.X, national average cash price) closed at $2.84, down 55 cents for the month. This is the lowest weekly close since the $2.27 posted at the end of September 2006. It is possible that the NCI.X could find support at the December 2008 low of $2.6890. Monthly stochastics are well below the 20% level, indicating the cash market is sharply oversold. It is possible the NCI.X could see a secondary bullish crossover in the coming months, confirming the initial pattern from February 2014.
Corn (Futures): The December contract closed at $3.20 3/4, 38.25ts lower for the month. The major (long-term) trend remains down with next support between the September 2009 low of $2.96 3/4 and the December 2008 low of $2.90. Monthly stochastics are well below the oversold level of 20%, with the last major signal a bullish crossover from back in March 2014. If the nearby contract stabilizes in October, monthly stochastics could establish a secondary (confirming) bullish crossover by the end of the month.
P[L1] D[0x0] M[300x250] OOP[F] ADUNIT[] T[]
Soybeans (Cash): The DTN National Soybean Index (NSI.X, national average cash price) closed at $8.57, down $3.23 for the month. The major (long-term) trend remains down. This is the lowest monthly close for the NSI.X since $8.30 from November 2009. Next support could be between $7.77 and $7.31, the lows from October 2008 and December 2008 respectively. Monthly stochastics have not moved below the oversold level of 20% yet, meaning more downside is possible for cash soybeans.
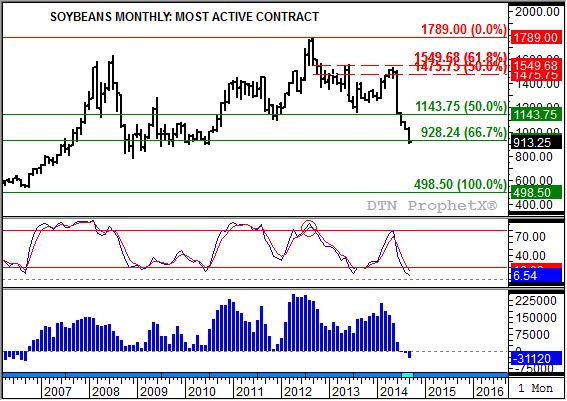
Soybeans (Futures): The November contract closed at $9.13 1/4, $1.11 lower for the month. The major (long-term) trend remains down, with the November contract closing below technical support near $9.28 1/4. This price marks the 67% retracement level of the previous major uptrend from $4.98 1/2 (February 2005 low) through $17.89 (September 2012 high). Monthly stochastics have moved below the oversold level of 20%, but remain months away (seemingly) from establishing a possible bullish crossover.
Wheat (Cash): The DTN National SRW Wheat Index (SR.X, national average cash price) closed at $4.28, down $0.87 for the month. The major (long-term trend remains down. The SR.X clearly broke support near $5.12 3/4, a price that marks the 67% retracement level of the previous major uptrend $3.12 (low from December 2008) through $9.14 (high from July 2012). Next support is at the previous low. Monthly stochastics are below the oversold level of 20%, though it could take months before a bullish crossover is seen.
SRW Wheat (Futures): The December Chicago contract closed at $4.77 3/4, 85.75cts lower for the month. The major (long-term) trend is down with next support at the June 2010 low of $4.25 1/2. Monthly stochastics moved below the oversold level of 20%, meaning there could be plenty of time for the market to move lower before any bullish signals are established.
To track my thoughts on the markets throughout the day, follow me on Twitter:www.twitter.com\Darin Newsom
Commodity trading is very complicated and the risk of loss is substantial. The author does not engage in any commodity trading activity for his own account or for others. The information provided is general, and is NOT a substitute for your own independent business judgment or the advice of a registered Commodity Trading Adviser.