
Technically Speaking Blog
The Return of the Widow Maker
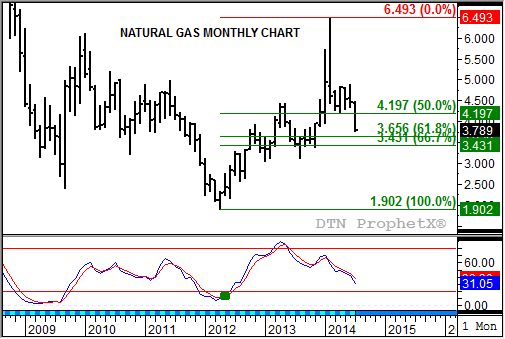
Natural gas, also known as the Widow Maker, seldom fails to make things interesting. This month has seen the market that often marches to the beat of its own drum, consistently work lower. So much so that the spot-month contract now appears to be targeting major (long-term) support on its monthly chart between $3.656 and $3.431. These prices mark the 61.8% and 67% retracement levels of its previous rally from $1.902 (April 2012) through its high of $6.493 (February 2014).
There are a couple of interesting things to point out about this previous move. Note that the April 2012 spike low occurred the month before a bullish crossover by monthly stochastics (bottom chart, green dot). The key to this is that the bullish crossover occurred below the oversold level of 20%, indicating a move to major uptrend.
The next month, June 2012, saw the spot-month contract post a bullish outside month (trading outside the May 2012 range before closing higher), confirming the uptrend. From there the market consistently worked higher before spiking to its February 2014 peak.
The question is now, has the trend turned down? Strictly from a technical point of view, the answer is no. Yes, I know, the market has fallen from its $6.493 high to this month's low of $3.755, but the technical signals are not there to suggest a possible downtrend returning the market to its previous low.
Take a close look at monthly stochastics as the market approached its peak. Notice that there appears to be a crossover above the 80% level back in May 2013. In reality though the faster moving blue line crossed below the slower moving red line the following month, June 2013, but below the overbought level of 80%. This kept the major uptrend in place.
How did the market respond? A look at the chart shows that after a period of consolidation near $3.43 it found the strength again to extend its uptrend to its February 2014 high.
P[L1] D[0x0] M[300x250] OOP[F] ADUNIT[] T[]
But even then, monthly stochastics could not approach the 80% level. Therefore, much like the Korean War that never officially ended, the major trend in natural gas remains up. And that being the case, the spot-month contract should find renewed buying interest at the previously mentioned price range between $3.656 and $3.431.
When should this low occur? Seasonally natural gas tends to post its low in late August, so it seems logical the market could take the next three to five weeks to establish a low for this move. Once the market makes its bullish turn, resistance would be the pocket of trade between roughly $4.20 (low from April 2014) and $4.90 (just above the high from June 2014). This range could be pinned down a bit once the low for the sell-off is established.
Commodity trading is very complicated and the risk of loss is substantial. The author does not engage in any commodity trading activity for his own account or for others. The information provided is general, and is NOT a substitute for your own independent business judgment or the advice of a registered Commodity Trading Adviser.