

Technically Speaking
Negatory on Those Interest Rates Good Buddy
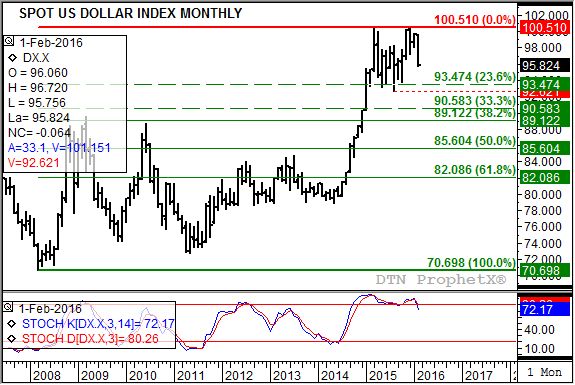
Those who have followed along with this blog know I've long believed the spot U.S. dollar index (USDX) was set for a downturn. If you look at the long-term monthly chart, this idea dates back to the March 2015 close of 98.357 after posting a high of 100.390. If you drop down to the monthly stochastics (bottom study) you see that this same month saw the establishment of a bearish crossover signaling the major uptrend that began in September 2011 had finally come to an end. A bearish crossover by stochastics occurs when the faster moving blue line crosses below the slower moving red line, with both above the overbought 80% level. Usually this signals a turn in market momentum is coming.
Initially the USDX did fall, consistently testing support at 93.474 from May 2015 through October 2015, including a spike low of 92.621 in August. From there the USDX rallied, spurred higher by the general knowledge that the Federal Reserve was indeed going to raise interest rates starting in late 2015 and lasting through 2016. Shortly after the Fed made a 0.25% move in December, the USDX posted a new high of 100.510.
P[L1] D[0x0] M[300x250] OOP[F] ADUNIT[] T[]
But a funny thing happened on the expected road higher. January saw the USDX lose momentum despite closing higher for the month. And then came February. As is clearly evident on the chart the USDX has dropped almost 4.000 from January's close, leaving fundamental and technical analysts debating the reasons as to why.
I've laid out the technical points above: a double-top formation combined with a bearish crossover by stochastics. Fundamentally there is a growing sense that the Federal Reserve not only won't move to make additional rate hikes in 2016, but could actually reverse course and follow the rest of the global Central Bank herd to negative interest rates.
That's right, Chairwoman Yellen has hinted this week that negative interest rates are more than just a possibility.
If this were to occur, and the first hint of it might not be until the Federal reserve meeting in March, it could be enough to drive the USDX below the August 2015 interim low of 92.621 (dotted red line). Then basic double-top measuring techniques would indicate the USDX could next test support at 85.604, a price that marks the 50% retracement level of the previous major uptrend from 70.698 through the 100.510 high. The math works out this way: Subtract the previous range of 7.840 (100.460 (midpoint of the two highs) - 92.621 (interim low)) from the interim low itself = 84.780.
The interesting thing to watch will be how fast monthly stochastics approach the oversold level of 20%. Only when this study is below the 20% mark might the established major downtrend be in position to come to an end.
To track my thoughts on the markets throughout the day, follow me on Twitter:www.twitter.com\Darin Newsom

Comments
To comment, please Log In or Join our Community .