

Technically Speaking
Beans' Bullish Breakout
I have to admit, there have been many times I doubted whether or not the November soybean contract would ever break out of its sideways trading range. Since late August, a long time in the life of commodities, the contract has been locked in a range between roughly $8.99 and $8.55, with only an occasional dalliance outside those borders and no closes above the high side since August 19.
And then came Tuesday, October 13. Not only did November soybeans crack the ceiling like a glass bridge in China, the contract shattered it with a close of $9.14 (the highest since $9.19 1/2 August 18). Technically (remember this), the implication is we would now flip the sideways trend to establish an upside target.
P[L1] D[0x0] M[300x250] OOP[F] ADUNIT[] T[]
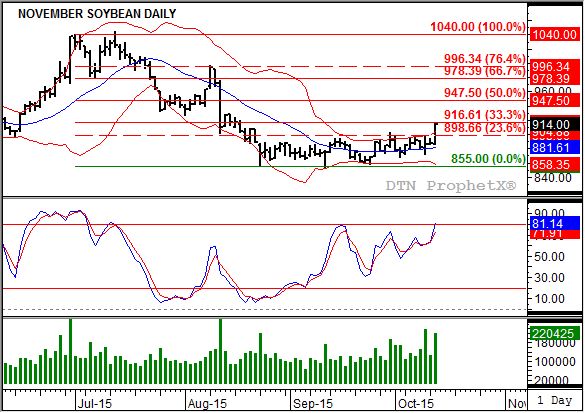
Simple enough. The difference between the high side of $8.99 and low side of $8.55 gives us a range of $0.44 cents. Flipping this puts the next target at $9.43. If you look at the daily chart you'll notice that this is in the neighborhood of resistance at $9.47 1/2, a price that marks the 50% retracement of the previous short-term downtrend from $10.40 through the $8.55 low (yes, I know, the contract low is $8.53 1/4 but it's an inconsequential difference).
Let me explain. The three lows on the daily chart are $8.55 (August 24), $8.53 1/4 (September 11), and $8.58 (September 24). The September 11 low was set following the release of a monthly USDA report, meaning it can be discounted to a certain degree, particularly given the close at $8.74 1/4. The $8.55 low from August is roughly the average of the other two, and coincides with a bullish crossover by daily stochastics (middle study, faster moving blue line crossing above the slower moving red line) below the oversold level of 20%. The other lows came with daily stochastics above this level. So, I'll continue to use the $8.55 low.
Let's go back to that upside target of $9.43. If we flip the page to the weekly chart for Nov beans (unfortunately, I can only show you the daily chart), the secondary (intermediate-term) trend is up. Oddly enough, this change came the week of the $8.58 low with the establishment of a bullish crossover by weekly stochastics, again below the oversold level of 20%. This brought to an end the downtrend from $12.32 (week of May 19, 2014) through the $8.55 low (I know it's confusing, but stay with me), and established initial resistance at the 23.6% (Fibonacci) retracement level of -- wait for it -- $9.44.
Back to the daily chart: Another bullish indicator is the growth in daily trade volume (bottom study, green histogram). Last Friday's rally saw November soybeans' volume spike to 236,691 contracts, followed by Tuesday's 220,425. When it comes to trade volume, higher numbers on rallies is a bullish signal while higher numbers on selloffs is considered bearish.
Now, I mentioned "technically" up at the top. Yes, it's in the name of this blog but many markets, including soybeans, have struggled following through on technical signals over the last year. That being said, it is highly likely November soybeans could give back roughly half of Tuesday's rally Wednesday, particularly if the commercial buying that supported the move disappears.
Nevertheless, from a technical point of view, November soybeans look to have finally established a bullish breakout with the ripple effects from the daily chart possibly reaching the major trend on the long-term monthly chart.
To track my thoughts on the markets throughout the day, follow me on Twitter:www.twitter.com\Darin Newsom

Comments
To comment, please Log In or Join our Community .