

Technically Speaking
Sugar: A Sweet Market Overlooked

DTN offers a number of quarterly market outlook webinars including grains, livestock, energy, and trading market sectors. The most recent was last Tuesday's (October 6) trading markets outlook where I analyze as many different markets as possible, looking for those with the best potential. Somehow I missed one showing an increasingly bullish structure at the end of September: sugar.
P[L1] D[0x0] M[300x250] OOP[F] ADUNIT[] T[]
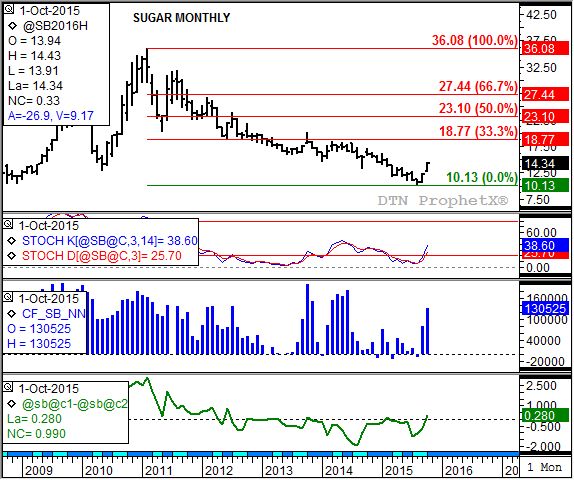
Take a look at the market's monthly chart. Note that the most active contract posted a new low of 10.13 (cents per pound) during August before closing at 10.69. At the same time (end of August) monthly stochastics (second study) were below 10% indicating a sharply oversold situation. Also, noncommercial traders were holding a net-short futures position of 11,275 contracts (third study, blue histogram) and the nearby futures spread (bottom study) was showing a carry of 1.08 cents. Six factor analysis would tell us this was a market set for a bullish turn.
And turn it did. Notice that September saw noncommercial traders switch from a net-short futures position to a net-long of 79,901 contracts, leading to a rally in the futures market (the most active contract closed at 12.17, all leading to a bullish crossover by monthly stochastics while still below the oversold level of 20%. In other words the major (long-term) downtrend from February 2011 had come to an end, replace by a newly established major uptrend.
Through early October noncommercial traders have continued to add to their net-long futures position, with Friday's CFTC report showing an increase to 130,525 contracts. Not to be outdone, the one-time carry in the nearby futures spread has turned into an inverse of 0.28ct, reflecting strong commercial buying tied to adverse weather in Brazil. The combination of buying from both commercial and noncommercial traders left a bullish breakaway gap between September's high of 13.25 and October's low (and open) of 12.87.
Given this turn to a bullish structure the nearby March contract could soon test its initial target of 18.77, a price that marks the 33% retracement level of the previous downtrend from 36.08 (February 2011) through the August 2015 low of 10.13. Note that this level held a series of monthly peaks from January 2013 through July 2014. However, if the market's structure (trends in both futures and spreads) remains bullish a 50% retracement to 23.10 is likely long-term.
To track my thoughts on the markets throughout the day, follow me on Twitter:www.twitter.com\Darin Newsom
Comments
To comment, please Log In or Join our Community .