

Technically Speaking
Monthly Analysis: Energy Markets
Brent Crude Oil: The spot-month contract closed at $48.37, down $5.78 on the monthly chart. The major (long-term) trend looks to be sideways with the spot-month contract consolidating within August's range from $54.32 to $42.23. Monthly stochastics remain below the oversold level of 20% but still months, presumably, from establishing a bullish crossover.
Crude Oil: The spot-month contract closed at $45.09, down $4.11 on the monthly chart. As with Brent crude the major (long-term) trend for WTI is sideways with the spot-month contract consolidating within August's trading range of $49.33 to $37.75. Monthly stochastics are below the oversold level of 20% but still likely months away from establishing a bullish crossover.
P[L1] D[0x0] M[300x250] OOP[F] ADUNIT[] T[]
Distillates: The spot-month contract closed at $1.5126, down 16.10cts on the monthly chart. Like the crude oil markets, the major (long-term) trend for distillates is sideways with the spot-month contract consolidating within August's trading range ($1.6865 to $1.3745). As with most of the energy complex, monthly stochastics are below the oversold level of 20%.
Gasoline: The spot-month contract closed at $1.3894, down 25.10cts on the monthly chart. The market continues to indicate it is in Wave 2 of a major (long-term) 5-wave uptrend, holding above its previous low of $1.2265 (January 2015). The last signal in monthly stochastics was a bullish crossover at the end of February 2015.
Ethanol: The spot-month contract closed at $1.53, up 7.5cts on the monthly chart. The major (long-term) trend is up with the most recent signal by monthly stochastics a bullish crossover at the end of April 2015. Resistance is pegged at $1.712, a price that marks the 23.6% retracement level of the previous downtrend from $3.070 (July 2011) through the low of $1.292 (January 2015). This resistance held the previous rally, posting a high of $1.709 in May 2015.
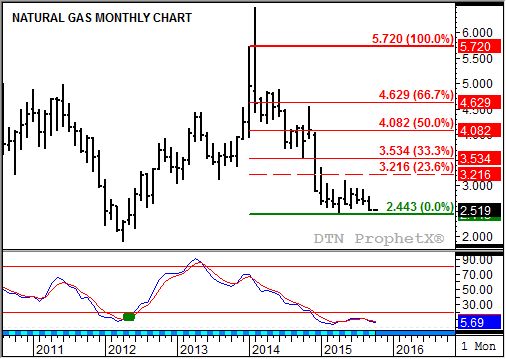
Natural Gas: The spot-month contract closed at $2.524, down 16.5cts on the monthly chart and near its monthly low of $2.511. The major (long-term) trend remains sideways with monthly stochastics well below the oversold level of 20%. Support remains at the previous low of $2.443 (April 2015).
Propane (Conway cash price): Conway propane closed at $0.4300, up 7.50cts on its monthly chart. The major (long-term) trend remains up with a target of $0.5542. This price marks the 23.6% retracement level of the previous major downtrend from $1.4825 (December 2013) through the low of $0.2675 (June 2015).
To track my thoughts on the markets throughout the day, follow me on Twitter: www.twitter.com\DarinNewsom

Comments
To comment, please Log In or Join our Community .