

Technically Speaking
NSI.X: "So You're Telling Me There's a Chance"
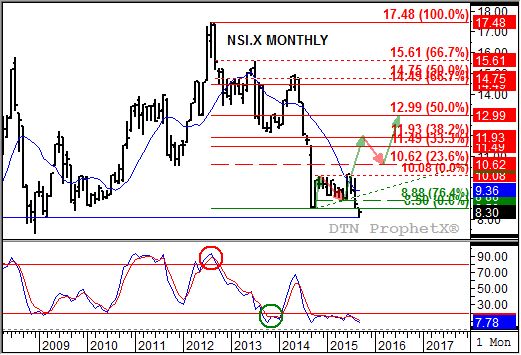
I'm going to go out on a limb and say, at first glance most of you don't see anything bullish about the DTN National Soybean Index (NSI.X, national average cash price) monthly chart. Moving to its lowest level since March 2009 (low of $8.08) is funny that way. But if you look closely and squint your eyes just right, you can see that the end of September brings with it the chance of the NSI.X posting an important bullish signal.
After posting its low of $8.09 on Sept. 22, the NSI.X climbed back to $8.35 (Sept. 25) before falling back this week to sit at $8.30 heading into the last day of the month. On its monthly chart, if the November futures contract sees a bullish reaction to the Sept. 30 Quarterly Stocks report and cash prices follow suit over the course of the afternoon, the NSI.X could be near its monthly high of $8.50 when calculated Wednesday evening. If so it could be argued that a spike bottom, also known as a V bottom, has been established.
But that opens the door to much, much more.
P[L1] D[0x0] M[300x250] OOP[F] ADUNIT[] T[]
If you look just to the left of this month's activity, you'll see that NSI.X posted a range of $9.97 to $8.57 in August. Look at that again and you see that there is a gap between the August low of $8.57 and the September high (so far) of $8.50. Therefore, if the soybean market sees a strong post-report rally to close near its monthly high, without closing the price gap, the potential for an island reversal in October is in play.
What would be needed? First: Again, a close near the September high without filling the previous gap. Second: Gapping higher when the NSI.X is calculated the evening of Oct. 1. This means the market has to trade high enough on follow-through buying to have the NSI.X come in above its September high, even with the seasonal weakening of national average basis (relationship between the NSI.X and the Nov futures contract). Third: The NSI.X has to maintain its October price gap through the rest of the month.
Easy enough, right?
This can all fall apart easier than a house of cards built outside on a wobbly picnic table in western Kansas on a windy summer day. Recall last year when USDA "surprised" most of the industry with its first Sept. 1 soybean stocks on hand figure below 100 million bushels since the 1972-1973 marketing year just weeks after holding to its ending stocks estimate of 130 mb (Thank you negative residual use.). The November 2014 contract closed down 10 cents. That's right, down a dime from its close of Sept. 29.
Therein lay the gift, and the curse, that makes Quarterly Stocks one of the few useful USDA reports in existence. Yes, I really believe that. Because quarterly stocks are looking backward, and based on what is supposed to be hard fact of what stored supplies are, the futures market doesn't usually get too excited. Or at least, not as much as when USDA needlessly looks into its cracked crystal ball and tries to project what will be for the single purpose of feeding speculative trade. Therefore, if soybean quarterly stocks were to come in near the average pre-report estimate of 204 mb (USDA pegged 2014-2015 ending stocks at 210 mb in its September Supply and Demand report), or better yet the low end of estimates at 165 mb (my analysis projected 170 mb following the June 30 report), the market may not see the bullish reaction one might expect.
Why? Investment funds are focused on the future, and the last bit of pabulum (definition: "insipid intellectual nourishment") USDA provided was crop production of 3.935 billion bushels, total supplies of 4.175 bb, total demand of 3.725 bb, ending stocks of 450 mb, and ending stocks-to-use of 12.1%. To summarize: Bearish, bearish, bearish, bearish and bearish.
Back to the chart: Notice that the September high of $8.50 was a test of old support at the October 2014 low, keeping in mind the old technical adage of "Once broken, support becomes resistance." Also, monthly stochastics (bottom study) are well below the oversold level of 20%, generally viewed as a precursor to a bullish change in trend. However, we've been here before, for much of 2015 actually despite a bullish crossover (green circle) established back at the end of November 2013 and December 2014. Neither of those generated the expected bullish momentum. Furthermore, monthly stochastics as September nears its end are not indicating a bullish crossover (faster-moving blue line crossing above the slower-moving red line), but it could be closer by the end of the day.
There's a chance; maybe less than one out of one hundred, but greater than one out of a million. The bottom line is I'm telling you there's a chance.
To track my thoughts on the markets throughout the day, follow me on Twitter:www.twitter.com\Darin Newsom

Comments
To comment, please Log In or Join our Community .