

Technically Speaking
Weekly Analysis: Grain Markets

Corn (Cash): The DTN National Corn Index (NCI.X, national average cash price) closed at $3.55, up 12 cents for the week. The secondary (intermediate-term) trend remains sideways-to-up with resistance at $3.67. This price marks the 50% retracement level of the sell-off from $4.06 through the low of $3.28. If the NCI.X were to climb above the August high $3.65 by the end of the month, and close above the August settlement of $3.40, it would establish a bullish outside month on the long-term monthly chart. This would confirm the major trend remains up.
Corn (Dec futures): The December contract closed 11.75cts higher at $3.89. The secondary (intermediate-term) trend remains sideways-to-up with initial resistance at the trendline mark of $3.92 1/2 this week, then the 4-week high of $3.95. Weekly stochastics are bullish above the oversold level of 20%.
P[L1] D[0x0] M[300x250] OOP[F] ADUNIT[] T[]
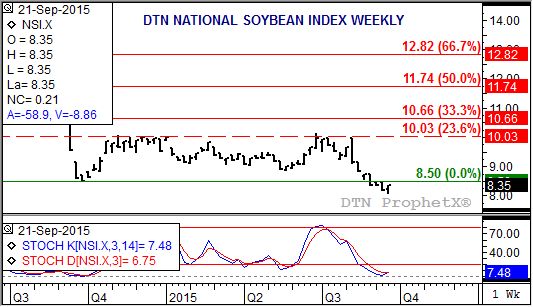
Soybeans (Cash): The DTN National Soybean Index (NSI.X, national average cash price) closed at $8.35, up 18 cents for the week. The NSI.X looks to have posted a bullish 2-week reversal last week, indicating the secondary (intermediate-term) trend has turned up. Also, weekly stochastics established a bullish crossover below the oversold level of 20%, confirming the pattern on the price chart. If the NSI.X extends its rally through the end of the month to close near its monthly high of $8.50, it would set the stage for a potential bullish island reversal on its long-term chart.
Soybeans (Futures): The November contract closed 22.00cts higher at $8.89 1/4. The secondary (intermediate-term) trend is sideways with resistance at the 4-week high of $8.94 1/2 and support at the 4-week low (contract low) of $8.53 1/4. Weekly stochastics posted a bullish crossover below the oversold level of 20% at the end of last week indicating upside momentum could begin to build. If Nov soybeans see a bullish breakout, flipping the sideways range of 41.25 cents ($8.94 1/2 to $8.53 1/4) puts the secondary target at $9.35 3/4. This would also be a test of resistance near $9.42 3/4, the 23.6% retracement level of the contract's downtrend from its high of $12.32.
SRW Wheat (Cash): The DTN SRW Wheat National Index (SR.X, national average cash price) closed at $4.49, up 21 cents for the week. The secondary (intermediate-term) trend is up with initial resistance at $4.61. This price marks the 23.6% retracement level of the previous downtrend from $6.23 though the low $4.11. The 33% retracement level is up at $4.81.
HRW Wheat (Cash): The DTN HRW Wheat National Index (HW.X, national average cash price) closed at $4.44, up 21 cents for the week. The secondary (intermediate-term) trend is up with an initial target of $4.62. This price marks the 23.6% retracement level of the previous sell-off from $6.41 through the recent low of $4.06. The 33% retracement level is up at $4.85.
HRS Wheat (Cash): The DTN HRS Wheat National Index (SW.X, national average cash price) closed at $4.96, up 36 cents for the week. The secondary (intermediate-term) trend is up with weekly stochastics bullish. Initial resistance is pegged at $4.97, the 23.6% retracement level of the previous downtrend from $6.68 through the recent low of $4.44. The 33% retracement level is up at $5.19.
To track my thoughts on the markets throughout the day, follow me on Twitter: www.twitter.com\DarinNewsom
Comments
To comment, please Log In or Join our Community .