

Technically Speaking
Weekly Analysis: Grain Markets

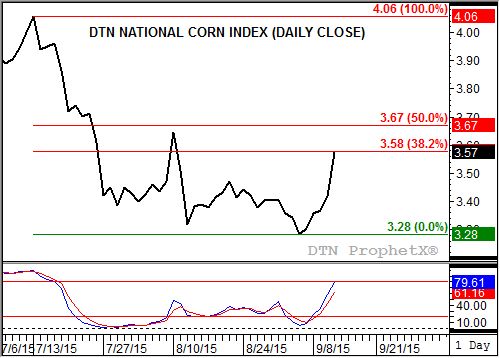
Corn (Cash): The DTN National Corn Index (NCI.X, national average cash price) closed at $3.57, up 27 cents for the week. The NCI.X looks to have reestablished its secondary (intermediate-term) uptrend following last week's solid rally. While weekly stochastics turned bullish, moving back above the oversold level of 20%, a bullish breakout could be confirmed with a move above the 4-week high (last week's) high of $3.57. While daily (minor, short-term) stochastics are bullish, the NCI.X is already testing minor resistance $3.58, a price that marks the 38.2% retracement level of the previous downtrend from $4.06 through $3.28.
Corn (Dec futures): The December contract closed 24.00cts higher at $3.87. Dec corn looks to have reestablished its secondary (intermediate-term) uptrend following last week's rally, but needs confirmation by posting a new 4-week high. The old mark is $3.87 1/2, last week's high, established shortly before Friday's close. Weekly stochastics show bullish momentum is building from the noncommercial side of the market. The minor (short-term) trend is also up, with initial resistance near $3.89 3/4. This price marks the 33% retracement level of the previous downtrend from $4.54 1/4 through the contract low of $3.57 1/2.
Corn (July futures): The July contract closed 23.50cts higher at $4.10. July corn is in position to reestablish a secondary (intermediate-term) uptrend, needing a move to a new 4-week high above $4.10 1/4 (last week's high) to confirm. Weekly stochastics have turned bullish, indicating the contract could start to find renewed buying interest from noncommercial traders. The minor (short-term) trend on the contract's daily chart is also up with initial resistance near $4.10 3/4, the 33% retracement level of the previous downtrend from $4.71 1/4 through the contract low of $3.80 1/2. The 50% retracement level is up near $4.26.
P[L1] D[0x0] M[300x250] OOP[F] ADUNIT[] T[]
Soybeans (Cash): The DTN National Soybean Index (NSI.X, national average cash price) closed at $8.36, down 1 cent for the week. Though seasonal, the continued weakening of national average basis (NSI.X minus the November futures contract) led to the lower weekly close by the NSI.X, extending both the secondary (intermediate-term) and major (long-term) downtrends. Despite monthly stochastics showing cash soybeans are sharply oversold, the NSI.X could look to test next major support at the March 2009 low of $8.08.
Soybeans (Futures): The November contract closed 7.75cts higher at $8.74 1/4. Last week's move to a new contract low of $8.53 1/4 (established immediately after the release of USDA's September reports Friday) extended the market's downtrends on daily, weekly, and monthly charts. However, the fact Nov beans rallied to close higher for the week could be seen as a possible spike reversal, indicating the contract has moved into a secondary (intermediate-term) sideways trend. Support would be at the new contract low and resistance the 4-week high of $9.23 3/4. Weekly stochastics remain bearish below the oversold level of 20%.
SRW Wheat (Cash): The DTN SRW Wheat National Index (SR.X, national average cash price) closed at $4.28, up 16 cents for the week. Despite posting an inside week (last week's price range was inside the previous week's price range of $4.35 to $4.11), weekly stochastics established a bullish crossover well below the oversold level of 20% indicating the secondary (intermediate-term) trend may be turning up. If so initial resistance is between $4.61 and $4.81, prices that mark the 23.6% and 33% retracement levels of the previous downtrend from $6.23 through last week's low of $4.11.
HRW Wheat (Cash): The DTN HRW Wheat National Index (HW.X, national average cash price) closed at $4.24, up 10 cents for the week. Similar to the SR.X (see above) cash HRW wheat looks to be moving into a secondary (intermediate-term) uptrend following the establishment of a bullish crossover by weekly stochastics. If so the price target area is between $5.00 and $5.39, prices that mark the 23.6% and 33% retracement levels of the previous downtrend from $8.04 through the recent low of $4.06. Initial resistance is at the 4-week high of $4.39.
HRS Wheat (Cash): The DTN HRS Wheat National Index (SW.X, national average cash price) closed at $4.57, up 11 cents for the week. Similar to the winter wheat markets (see above) cash HRS wheat looks to be moving into a secondary (intermediate-term) uptrend following the establishment of a bullish crossover by weekly stochastics. If so the price target area is between $4.97 and $5.19, prices that mark the 23.6% and 33% retracement levels of the previous downtrend from $6.68 through the recent low of $4.44. Initial resistance is at the 4-week high of $4.66.
The weekly Commitments of Traders report showed positions held as of Tuesday, September 8.
To track my thoughts on the markets throughout the day, follow me on Twitter: www.twitter.com\DarinNewsom
Comments
To comment, please Log In or Join our Community .