

Technically Speaking
Bottoms Up in Chicago Wheat

I've been dealing with the wheat market for as long as I can remember; growing up on a Kansas wheat farm watching my dad struggle to makes sense of price moves, merchandising grain for a cooperative in the central part of the state, to being one of the few analysts the IPTV Market to Market program likes to have lead off the analysis segment talking wheat. And all along the way I've said the same thing: Wheat is one of the hardest markets to analyze.
Corn is relatively simple, as it tends to follow its technical patterns fairly closely. Soybeans are an over-caffeinated, jumpy market and always have been. But wheat is different, posting nearly as many false technical signals (head fakes) as real, making the question of which ones to trust difficult to answer. This week's activity by the September Chicago (SRW) contract may not have as much to do with a head fake as a false bottom.
P[L1] D[0x0] M[300x250] OOP[F] ADUNIT[] T[]
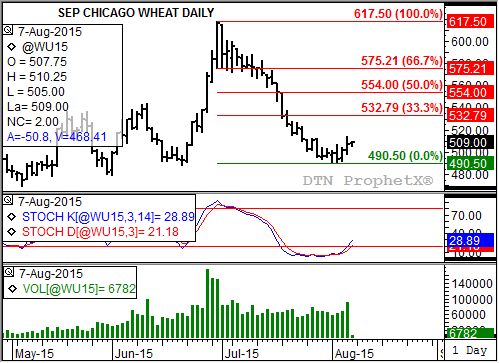
Take a look at the daily chart for the Chicago Sept and you'll see a well-rounded bottom. Ahem. Let me restate that. Take a look at the daily chart for Chicago Sept and you'll see a rounding bottom pattern.
Characteristics of a classic rounding bottom (saucer bottom, bowl) is a gradual shift from down to up (or up to down in a rounding top). Also, daily volume (bottom study, green histogram) tends to post a saucer pattern as well. Using your imagination a bit due to a skewed scale accounting for the most recent low volume overnight session, you can see what looks to be a saucer shape in daily volume.
Thursday's session saw the contract take out its previous daily highs at $5.12 1/2 (July 28 and 29), posting a high of $5.14 on increased trade volume. This seemingly confirms the bullish crossover established by daily stochastics below the oversold level of 20%. All of this combined indicates the minor (short-term) trend has turned up.
The first possible target is near $5.32 3/4, a price that marks the 33% (Dow Theory) retracement level of the previous downtrend from $6.17 1/2 (June 30) through the $4.90 1/2 low (August 3). However, given the bullish commercial outlook indicated by the weak carry in Chicago wheat's forward curve (series of futures spreads from the September 2015 contract through the May 2016 contract) Chicago Sept could possible make a run at its 50% retracement level of $5.54.
It should be noted that a similar pattern is not seen on the daily chart for the September Kansas City (HRW) contract, though the less heavily traded markets of Kansas City and Minneapolis (HRS) could see some spillover buying from Chicago.
To track my thoughts on the markets throughout the day, follow me on Twitter:www.twitter.com\Darin Newsom
Comments
To comment, please Log In or Join our Community .