

Technically Speaking
USDX: The "Some" of All Fears
This past Wednesday the Federal Reserve released its July comments regarding end-of-the-world like increase in interest rates (we know it's coming, just not when). Much of what was said has been heard before, except for one little four-letter word -- some.
Month after month the Fed has stated something to the effect it was waiting to see "further improvement in the labor market." This time around though, the statement read, "The Committee anticipates that it will be appropriate to raise the target range for the federal funds rate when it has seen some further improvement in the labor market and is reasonably confident that inflation will move back to its 2 percent objective over the medium term."
Did you see what they did there? They inserted the word "some", creating "some" confusion as to whether or not the fed fund rate will actually be raised in September.
P[L1] D[0x0] M[300x250] OOP[F] ADUNIT[] T[]
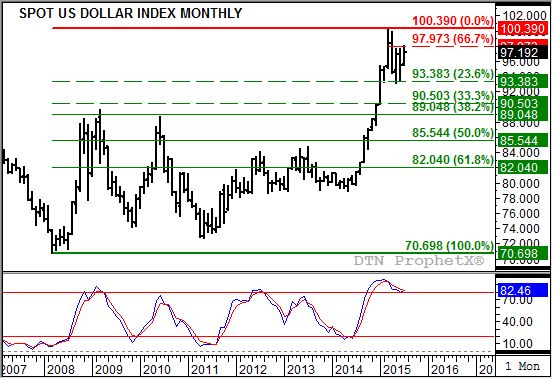
As most of you know, or at least those of you following along with this blog, the U.S. dollar index (USDX) posted a strong uptrend from May 2014 through March 2015, concluding a bullish pattern that actually began back at the end of April 2008. While global economic events have come and gone, all playing a role in the swings of the USDX, the closing 11-month rally was supported in large part by the idea that the fed fund rate would be raised.
However, the sharp sell-off seen this past April established a 2-month reversal on the USDX monthly chart, signaling the major (long-term) trend had turned down. How is this possible if the fed fund rate was still in that murky range between 0.00% and 0.25%?
Those who have been around the block with the markets know the old adage of "Buy the rumor, sell the fact". According to indication on the monthly chart, traders are tired of buying the rumor and ready to sell the fact.
After posting its bearish reversal in April, complete with a bearish crossover above the overbought level of 80% by monthly stochastics, the USDX fell to a low of 93.133 during May. This test of support at 93.383, the 23.6% retracement level of the previous major uptrend from 70.698, held and sparked a rally back to a high in July of 98.151. Notice that this was a test of resistance at 97.973, the 67% retracement level of the initial sell-off from March through May.
My analysis of the USDX is unchanged: The current rally looks to be nothing more than Wave B of a 3-wave downtrend, meaning a possible test of resistance at the 76.4% retracement level of 98.677 is likely. Monthly stochastics remain bearish, with a potential rally the next couple of months setting up a potential secondary (confirming) bearish crossover. Ultimately Wave C (final wave of the downtrend pattern) could reach the support area between 90.503 and 89.048, the 33% and 38.2% retracement levels of the previous uptrend.
From the perspective of the commodity sector, the fear of a stronger USDX due to the much anticipated rate hike in 2015 could hang on what happens with the newly inserted word "some". Most of the major markets (corn, crude oil, etc.) are showing signs of major uptrends that would fit with the conclusion (based on analysis of its monthly chart) that the USDX should soon turn down again.
To track my thoughts on the markets throughout the day, follow me on Twitter:www.twitter.com\Darin Newsom

Comments
To comment, please Log In or Join our Community .