Technically Speaking
Soybeans: "Slip Slidin' Away"
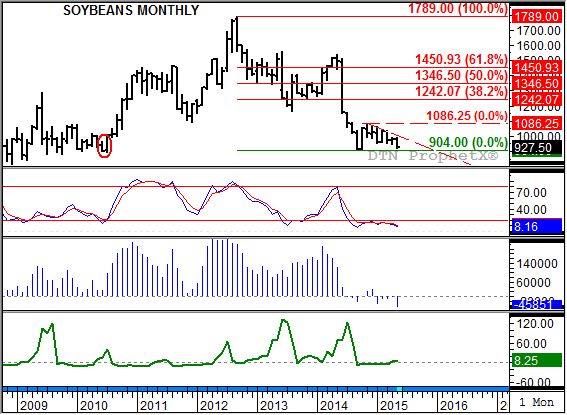
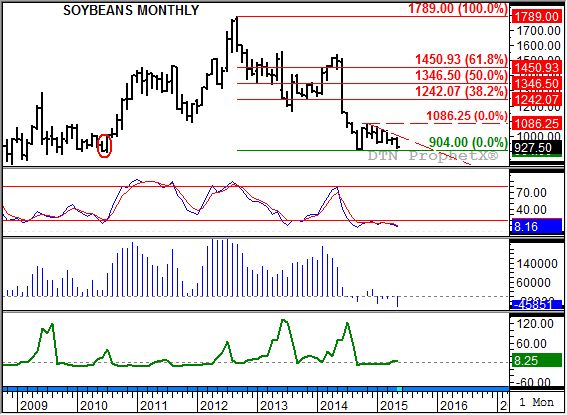
Soon the November contract will begin registering on the continuous monthly chart as the most active contract (see attached), and unless something changes dramatically in the weeks ahead, it will do so laying against the October low of $9.04.
The few remaining soybean market bulls realize just how important this price is, for a break of the October low could technically erase thee bullish key reversal posted that month that signaled the end of the major (long-term) downtrend.
P[L1] D[0x0] M[300x250] OOP[F] ADUNIT[] T[]
After rallying to an initial high of $10.86 1/4 last November, the market has been sliding back to the October low on continued pressure from noncommercial selling (third study, blue histogram). Weekly CFTC Commitments of Traders reports show this group moving to a net-short futures position by the end of last July. After moving back to a net-long at the end of both November and December, increased selling through late May now has the noncommercial net-position short almost 46,000 contracts, the largest net-short futures potion since the end of January 2005 (not shown).
The interesting thing about this selling is that it has occurred despite ongoing signals of bullish supply and demand. Take a look at the line chart for the nearby futures spread (bottom study), and you'll see the market has been inverted to showing only a small carry since the beginning of the downtrend at the end of September 2012. Note that at the time, noncommercial traders were still holding a net-long futures position of more than 240,000 contracts.
This creates an interesting discussion of market type, possibly a subject for an upcoming On the Market column. In a nutshell, a market with a bearish noncommercial side and bullish commercial side is classified as Type 7, defined as a relatively rare market that doesn't last all that long. Given that it is approaching three years now, structural analysis of soybeans may be evolving.
Anyway, that's for another day. Today's question is what happens when November soybeans take over the role of most active contract? If it is at or slightly above the October low (Nov beans closed last Friday at $9.07) then it could establish a possible double-bottom formation. If, however, the contract has slipped below the $9.04 mark then we'll use a simple measuring technique to set a downside target.
Subtracting the previous low ($9.04) from the interim high ($10.86) gives us a range of roughly $1.82. Now subtracting the previous range ($1.82) from the previous low ($9.04) sets a technical target price of $7.22. The last time the soybean market was that low occurred back in January 2007.
Could soybeans fall that far? If we use Newton's First Law of Motion applied to commodities (A trending market will stay in that trend until noncommercial traders change their position.), then the answer is "yes". However, we need to keep in mind that futures spreads are not bearish, with the new-crop forward curve showing a neutral level of carry (a Type 8 market). Also, monthly stochastics for the soybean market are nearing single-digits, indicating a sharply oversold situation. This combination of factors could ultimately lead to a round of noncommercial short-covering, possibly enough to start a rally if futures spreads start to grow more bullish.
To track my thoughts on the markets throughout the day, follow me on Twitter:www.twitter.com\Darin Newsom


Comments
To comment, please Log In or Join our Community .