

Technically Speaking
July Corn: Time (?)

Time can pass quickly, as anyone with children knows. Or it can move like molasses in winter, as the few remaining corn market bulls waiting for the establishment of bullish technical signals will attest. However if the weekly chart for the July contract can be believed, the wait may finally be getting close to over.
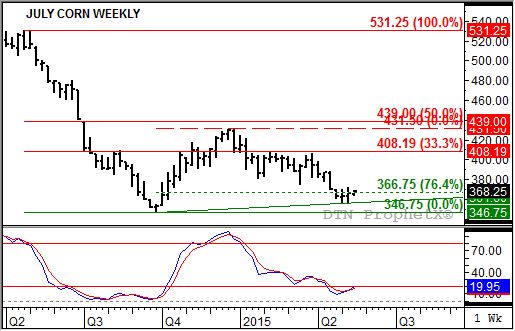
This past winter the corn market established bearish technical signals indicating the secondary (intermediate-term) trend had turned down. In the case of July, this occurred the week of December 29 as the contract posted a bearish reversal (traded outside the previous week's range before closing lower) that coincided with a bearish crossover by weekly stochastics (bottom study) above the overbought level of 80%. Note that the high that week was $4.31 1/2, a test of resistance at $4.39. This price marks the 50% retracement level of the previous secondary downtrend from $5.31 1/4 through the low of $3.46 3/4.
P[L1] D[0x0] M[300x250] OOP[F] ADUNIT[] T[]
Since then the corn market, including the July contract, has continued to grind lower, working its way through technical price support levels. The last three weeks has seen July corn hang on to support at $3.66 3/4 (the 76.4% retracement level of the uptrend from $3.46 3/4 through the high of $4.31 1/2) by its fingernails. Last week, July corn closed 2 1/2 cents higher (for the week) at $3.65 1/2. This week's begins with the contract priced near $3.68 1/2.
Along with the slow slide lower in price, weekly stochastics worked their way from overbought to oversold, setting the stage for a potential bullish crossover that would signal a change in secondary trend. Last week's slightly higher close in July corn led to just such an event, the first bullish crossover since the bullish crossover at the close of the week of October 6, 2014 (itself a confirming signal to the previous bullish crossover the week of August 11, 2014).
Does this mean the corn market is going to turn on its heels and quickly run higher? Probably not. But it does indicate the secondary trend has at least turned sideways and could start to build toward a pattern that would signal the major (long-term) uptrend is beginning Wave 3 of its 5-wave (Elliot Wave Theory) uptrend (for further discussion on this, see my On the Market column "Papillon's Escape" from May 8). The next pattern I'm looking for would be the establishment of a new 4-week high, possibly occurring the first week of June.
Why would the market rejoin its major uptrend if all the headlines are bearish? That's where we can analyze the different components (futures, basis, cash) of the market to get a clearer picture. In the case of corn, the futures market looks to be the first to turn bullish with the cash market (DTN National Corn Index, NCI.X, national average cash price) still showing bearish weekly stochastics.
What's the significance of bullish futures and lagging cash? This structure would indicate the initial support is coming from noncommercial traders, most likely covering some of their net-short futures holdings. Last Friday's weekly CFTC Commitments of Traders report showed this group adding 720 contracts to their net-short position (as of Tuesday, May 12). Meanwhile national average basis (NCI.X minus the close of July contract) weakened by about a 1/2 last week.
The cash market could struggle a bit with the weight of stocks. Supplies of on-farm cash corn could start to move to town as we move into the fourth-quarter of the 2014-2015 marketing year and planting of the 2015 crop nears its end. If demand picks up significantly, something both futures spreads and USDA are indicating should happen, then both corn futures and cash corn should move higher with futures holding the lead.
To track my thoughts on the markets throughout the day, follow me on Twitter:www.twitter.com\Darin Newsom
Comments
To comment, please Log In or Join our Community .