

Technically Speaking
July Sugar: First the Market Move, Then the Headlines
Over the weekend, a Wall Street Journal news stories talked of one company's large purchase, Wilmar International Ltd., sending the world sugar market "scrambling" last Friday. As the article reported, "More than a dozen ships are now lined up at Brazilian ports to transport the sugar to Asia." Later in the piece it was said that "some analysts think it could be the harbinger of stronger-than-expected global sugar demand".
I find this thought interesting for a couple of different reasons. First, last week saw Mars (the candy company, not the red planet) release a statement announcing its support for added sugar labeling. In his latest blog, "On Added-Sugar Labeling, Mars Is From Mars", DTN Editor Emeritus discusses the whys and wherefores of Mars' stance. Second, this weekend's news once again confirms the basic tenet of technical analysis: If everything that affects market price is ultimately reflected in market price, then the study of that market price is all that is necessary. [Technical Analysis of the Futures Markets, pg. 3; John J. Murphy]
Or as I like to say: First the market move, then the headline.
P[L1] D[0x0] M[300x250] OOP[F] ADUNIT[] T[]
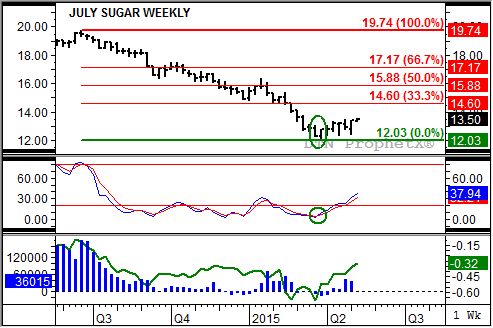
Take a look at the attached weekly chart for July sugar. Notice the green circles on both the bar chart (top chart) and weekly stochastics (second study). These market the bullish technical signals that indicated the market was already in a secondary (intermediate-term) uptrend, long before Friday's big buy by Wilmar.
On its bar chart the July sugar contract posted a classic 2-week reversal the weeks of March 23 and March 30. Remember the three characteristics of such a pattern: 1) the market sets a new low for the move (12.26 cents per pound) before closing near that low (12.29); 2) The market opens the next week near unchanged (12.28) before 3) Closing near the previous week's high (12.80, 13.05 respectively). The week of April 13 saw the contract post a high of 13.03, moving above its previous 4-week high of 13.10, another indicator the secondary trend had turned up.
At the same time, the week of March 30 to be specific, July sugar's weekly stochastics posted a bullish crossover below the oversold level of 20%. This is a familiar technical signal that I look for indicating momentum, and likely the trend, of a market/contract has changed.
Those of you familiar with my analysis know I also use trends to indicate changes in fundamentals (supply and demand). In the case of sugar, this is complicated by the fact that July is still old-crop (2014-2015) while the next contract, October, is new-crop. Showing that spread activity bottom study, green line) can be like comparing apples to oranges, but in this case the uptrend (weakening carry/contango) that began that same week of March 30 reflects increased commercial buying of old-crop versus new, usually due to a short-term change in supply and demand.
Activity from the other side of the market, noncommercial traders, is reflected in the trend of the futures market, and confirmed by weekly CFTC Commitments of Traders reports (bottom study, blue histogram). In the case of sugar, this group held a net-short futures position of 16,673 contracts the week of March 30. This group then not only covered their net-short, but moved to a net-long of 43,219 contracts through the week of April 27.
If buying from both sides continues the contract could soon test its initial price target of 14.60, the 33% retracement level of the previous secondary downtrend from 19.74 through the 12.03 low. However, an increasingly bullish view of old-crop fundamentals could lead to a 50% retracement up at 15.88.
To track my thoughts on the markets throughout the day, follow me on Twitter:www.twitter.com\Darin Newsom

Comments
To comment, please Log In or Join our Community .