

Technically Speaking
Taking Left Fied on the US Dollar Index

Unless you're Alex Gordon, it's often not viewed as a good thing to constantly be stationed out in left field. Outside of baseball, this phrase is said to mean "unexpectedly", "odd", or "strange". This definition has morphed into a deeper meaning of "out of contact with reality".
(Baseball announcer voice): And now for your starting nine. Out in left field, Darin Newsom.
P[L1] D[0x0] M[300x250] OOP[F] ADUNIT[] T[]
On the analytical field, I have frequently manned left field. This year alone I have been a member of the "Bullish Corn Club", "Society of Livestock Bears", "Gasoline is Going Higher Group", and now the sole associate of "TWTUSDXGD" (Those Who Think the U.S. Dollar indeX is Going Down).
Last Wednesday's I posted a blog discussing the completion of a double-top formation in the U.S. dollar index (USDX) projecting a sell-off back to support near 92.180. This price marks the 38.2% retracement level of the previous secondary (intermediate-term) uptrend from 78.906 to the high of 100.390. However, as April came to a close the indexes monthly chart indicated a stronger sell-off was possible.
In his book "Technical Analysis of the Futures Market", John J. Murphy lists the three common characteristics of a 2-day reversal. First, a market posts a new high and closes near that high on day one. Second, the next day sees the market open near the close of the first day. Third, the second day the market posts a sharp sell-off before closing near the low of the first day. Keep in mind something Murphy put in the book that I've used constantly over the last 25 years: The same patterns can be seen on weekly and monthly charts, gaining in importance the longer the timeframe.
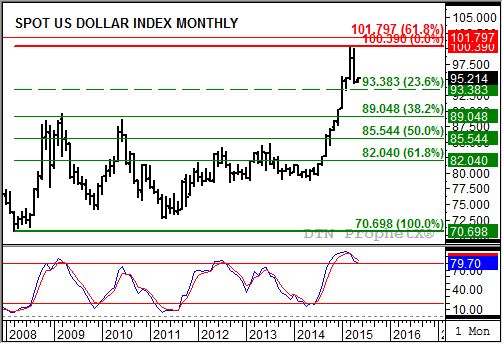
Let's take a look at the monthly chart for the USDX. In March it posted a low of 95.063 before rallying to a new high of 100.390 and a monthly close of 98.357 (Characteristic 1? Check). In April the USDX opened at 98.398 (Characteristic 2? Check). As April progressed the USDX was unable to make a new high (99.990) before falling to 94.399 and closing at 94.600, near the March low of 95.063 (Characteristic 3? Check).
Therefore the USDX is now another market that, if I were to take the title off the chart and ignore what I think I know about fundamentals, would show me a clear, indisputable, technical signal. In this case, a classic 2-month reversal confirming the bearish crossover by monthly stochastics (bottom study) above the overbought level of 80% established at the end of March.
If the USDX has established a major (long-term) top, how far might it fall? As I pointed out earlier, initial support on the weekly chart is near 92.180. However, initial support on the long-term monthly chart is at 89.048, the 38.2% retracement level of the previous major uptrend from 70.698 (March 2008 low) through 100.390 (March 2015 high). If you turn back to my discussion of the weekly chart, you'll see that the secondary 50% retracement level is pegged at 89.648. Given the similarity between the major 38.2% retracement (89.048) and the secondary 50% retracement (89.648), the major target seems likely to be tested.
To track my thoughts on the markets throughout the day, follow me on Twitter:www.twitter.com\Darin Newsom
Comments
To comment, please Log In or Join our Community .