

Technically Speaking
Doubling Down on the US Dollar Index
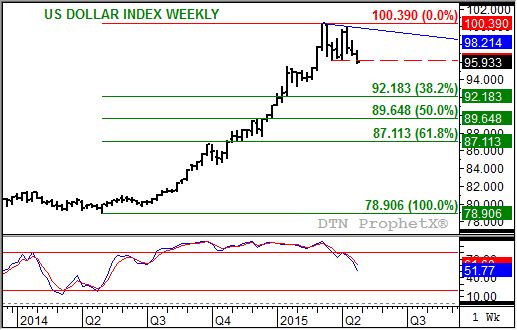
The U.S. dollar index (USDX) has been on a wild ride since posting a low of 78.906 the week of May 5, 2014. Though it took a while before finally breaking out of its sideways trend (week of August 18, 2014), the USDX went on a steady climb to its high 100.390 the week of March 9, 2015.
If you take a close look at the chart, you see the USDX has often indicated a potential topping formation. One of the more noteworthy occurrences was in early December 2014, leading to the conclusion that I presented in my annual market outlook at the annual DTN/The Progressive Farmer Ag Summit that, due in part to it being overbought, the USDX was set to turn down. I remember DTN Editor Emeritus Urban Lehner calmly pointing out to me that markets can be overbought for a long time. As usual, Urban turned out to be correct.
Oddly enough, what looked to be a top near 89.500 in early December is now a potential retracement level. If the USDX is indeed, finally, establishing a secondary (intermediate-term) downtrend on its weekly chart the 50% retracement level of the previous uptrend is pegged at 89.648. Before that, though, the USDX has to fall through potential support at 92.183, the 38.2% retracement level.
P[L1] D[0x0] M[300x250] OOP[F] ADUNIT[] T[]
Interestingly enough, that's just where recent activity indicates the USDX may be headed. After posting its 103.390 high, it fell to a low of 96.170 (dashed red line) before rallying back to a second peak of 99.990. This inability to post a new high set the stage for possible double-top formation, needing only a move below the previous low 96.170 to confirm.
Which leads us to this week's activity, with the USDX now clearly trading below its previous low (Wednesday morning finds the USDX priced at 95.500. Now that we have a confirmed double-top, what do we do with it?
Projecting a downside target is relatively easy in a double-top formation. There are two was of going about it: First, take the initial low and measure to the trendline connecting the two highs. In this case, that comes to 4.060 (100.230 - 96.170). Subtracting that range from the bearish breakout point (previous low of 96.170) gives us a target price of 92.110 (96.170 - 4.060). The second way of measuring takes the length of the first leg down from the original high to the initial low. In this case that would be 4.220 (100.390 - 96.170). Subtracting that from the previous low puts the downside target at 91.950.
In this case there isn't much difference in the two target prices. Either way the USDX is looking at a potential test of its 38.2% retracement level of 92.183.
Weekly stochastics (bottom study) also indicate that the USDX is in a secondary downtrend. Following another bearish crossover (faster moving blow line crossing below the slower moving red line, with both above the overbought level of 80%) the week of March 16, bearish momentum seems to be building. With stochastics quickly dropping, this momentum study could be near the oversold level of 20% as the USDX approaches its projected target at the 38.2% retracement level.
And if the USDX is trending down, this could be the catalyst for noncommercial traders to cover some of their net-short futures positions in commodities. Two markets that quickly come to mind are soybeans and Chicago wheat. Others also showing net-short futures position (in the latest CFTC Commitments of Traders report) are Kansas City wheat, lean hogs, and distillates (heating oil).
To track my thoughts on the markets throughout the day, follow me on Twitter:www.twitter.com\Darin Newsom

Comments
To comment, please Log In or Join our Community .