

Technically Speaking
Another Thelma-and-Louise Pattern in Crude Oil

2014's sharp sell-off in crude oil brings to mind the Thelma-and-Louise pattern (driving off a cliff) seen back in 2008. I'm sure most of you recall that move, the one that started with a bearish key reversal on the monthly chart in July after posting a new high of $147.27 and ended with a bullish crossover by monthly stochastics at the end of April 2009.
On the 18th of that December 2008, my Technically Speaking post (can't believe I've been blogging this long) was titled "Crude Oil's Search for Support". I've attached the original below today's post. In it I talked of how the spot-month contract had blown through technical price support at key retracement levels, opening the door to a test of possible support at a series of previous lows (November 2002 through April 2003) at roughly $25.00. Beyond that was the low from November 2001 of $16.70.
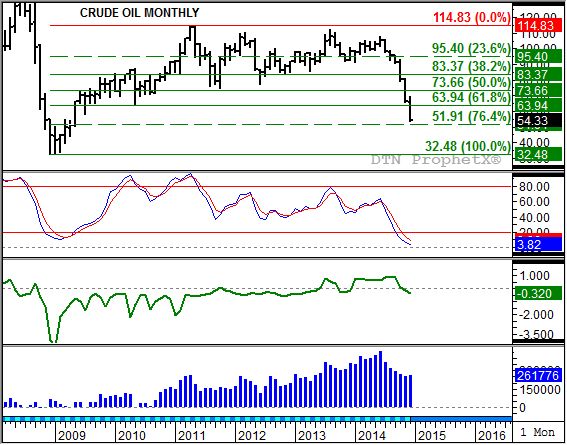
As events would play out, the market posted its low of $32.48 that December (2008), starting a rally that lasted through the high of $114.83 in May 2011 when another bearish key reversal was posted. It is that previous uptrend ($32.48 through $114.83) that set the retracement levels we've been dealing with during the 2014 Thelma-and-Louise sequel.
P[L1] D[0x0] M[300x250] OOP[F] ADUNIT[] T[]
A look at the chart shows that I've added a couple of Fibonacci retracement levels. The first, the 23.6% retracement line of $95.40 had repeatedly been broken since the May 2011 peak, the last time this past August. As expected, the 38.2% retracement level performed relatively well during the sideways to down period from May 2011 through August 2014, though there were breaches down to the 50% retracement level between August 2011 and October 2011, then again in June 2012.
This year though, the market didn't stop at the 50% retracement level, or the 61.8% retracement level of $63.94. In fact, neither of those even caused the market to pause momentarily (figuratively speaking, this being a monthly chart). The last potential line of support before a full retracement back to $32.48 is projected would be the 76.4% level of $51.91. This week has seen the spot-month contract post a low of $53.60, showing few signs of slowing.
But possible signs of a turn there are. Recall that back in 2009 it was the slow establishment of a bullish crossover by monthly stochastics (the faster moving blue line crossing above the slower moving red line, with both below the oversold level of 20%) that started the market on its major (long-term) uptrend. This time around we again find monthly stochastics (second study) below the 20% line, so far below both are in single digits. Though no bullish crossover is being indicated as we cross the mid-point of December, the flow of investment money out of crude oil seems to have slowed to a trickle.
Take note of the blue histogram (bottom study). This shows the noncommercial net-futures position pulled from weekly CFTC Commitments of Traders reports at the end of each month. Notice that in December 2014 this group has increased its net-long futures position slightly since the end of November, from 253,001 contracts to last Friday's reported (for the previous Tuesday's positions) 261,776 contracts. Keep in mind though that these positions are again as of Tuesday, the week of the reports, meaning the sharp sell-off seen Monday and Tuesday of this week could result in a lower net-long futures position.
So what might the future of crude oil hold? Recalling Newton's First Law of Motion applied to trend analysis (A trending market will stay in that trend until acted upon by an outside force.), and assuming increased noncommercial buying interest could be that force, crude oil could be nearing its low with this test of support at $51.91. Again, monthly stochastics are well below the oversold level of 20% with little room to decrease.
But a full retracement isn't out of the question either since the nearby futures spread (third study, green line) also remains in a downtrend (strengthening carry/contango, an increasingly bearish view of market fundamentals). The bottom line is there seems to be no rush by anyone to be the first in line to buy crude oil.
Technically Speaking blog post from December 18, 2008:
| Crude Oil's Search for Support |
| Aquick look at the continuous monthly chart in crude oil shows how the current selloff has shown a lack of interest in technical support areas. As the market moved into free fall mode in July 2008 the spot-month contract easily and seemingly without hesitation moved through projected support levels at the 33 percent, 50 percent, and 67 percent retracement levels. While some would argue that it discredits technical analysis as a whole, I believe it proves how powerful a market can become in the midst of a strong change in trend. In a situation like this, it is often best to throw out most technical analysis tools and look for simple support (or resistance) levels. That being the case a line of support can be drawn at $40 (the low from December 2004) then at $25 (a series of lows from November 2002 through April 2003). Wednesday's session - as well as the subsequent overnight session - saw the spot-month January contract trade below $40 as it established a low of $39.19. While a small rally wouldn't be that surprising, this break of support would indicate the market should ultimately test the next level of support at $25. But will that price hold? A look at the nearby futures spread chart at the bottom of the continuous monthly chart shows crude oil to be in as bearish a supply and demand situation that has ever been seen in the futures market. The nearby futures spread is trading near the $4.50 carry (contango) level as compared to the 22 cent carry in April 2004 and the slight inverse (backwardation) seen back in late 2002/early 2003. That would seem to indicate that $25 may just be another mile marker on the path lower in crude oil. Realistically it is hard to imagine the market going much lower but if it does, then analysts will have start looking at the next low of $16.70 in November 2001. P.S. - The $25 target is not something new. Back in November in a CNBC interview I laid out the argument for this price target if the $40 support level gave way. While it seemed a bit unbelieveable to many at the time, it is becoming closer to reality. See the interview on the attached link: http://www.cnbc.com/… |
To track my thoughts on the markets throughout the day, follow me on Twitter:www.twitter.com\Darin Newsom
Comments
To comment, please Log In or Join our Community .