

Technically Speaking
Sub-$74 Crude Oil
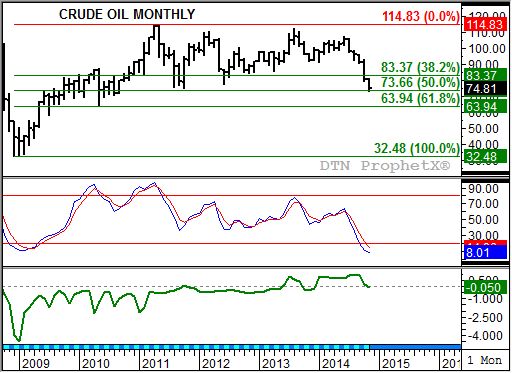
Those watching the crude oil market closely have seen the spot-month contract dip below $74 per barrel, posting a low of $73.25 last week and $73.88 Tuesday evening into Wednesday morning. The last time the spot-month crude oil contract was this low was back in September 2010 when it posted a low of $71.67, a high of $80.18, and closed at $79.97 on its way to the eventual high of $114.83 in May 2011.
Since then the crude oil market has posted a wide trading range, but largely been viewed as moving in major (long-term) sideways trend. A look at the monthly chart shows that after posting its May 2011, part of a key bearish reversal the spot-month contract fell to a low of $74.95 in October 2011. Again notice that a bullish key reversal was established, leading to a test of the previous high in March 2012 (high of $110.55).
P[L1] D[0x0] M[300x250] OOP[F] ADUNIT[] T[]
After that, the market has been a picture perfect example of consolidation, including its monthly stochastics (second study).
That is until recently. This past July saw another bearish crossover occur in monthly stochastics, below the overbought level of 80% but reigniting the major downtrend that began with the one occurring above the 80% level at the end of May 2011. August saw the spot-month contract move to a new 4-month low of $92.50, a move that triggered the slide back to test major support levels first at $83.37 then $73.66. These prices mark the 38.2% and 50% retracement levels of the previous major uptrend from $32.48 (December 2008 low) through the $114.83 high.
The question now is will the 50% level hold this sell-off? Monthly stochastics have moved below the oversold level of 20% but remain possibly months away from establishing a major bullish crossover. This means that the 50% retracement level of $73.66 could hold for a while, but the continued bearishness of the market's supply and demand situation could lead to a test of the 61.8% retracement level of $63.94.
Bearish supply and demand, you ask? The nearby futures spread (bottom study, green line) is sitting at only a small contango/carry in November. Given DTN analysis, wouldn't bearish fundamentals result in a much stronger contango in the market's forward curve (series of futures spreads)? The answer, in true commodity analyst fashion, is both yes and no.
The ongoing sell-off in crude oil created a short-term change in market dynamics. The underlying supply and demand situation is so bearish long-term, traders put increased pressure on deferred futures contracts. This led to the market actually showing backwardation/inverse in its forward curve until just recently. However, a look at the spreads weekly close only chart (not shown, but in DTN's Market Strategy) shows a strong downtrend indicating that this key indicator is moving back in line with traditional analysis.
Is a $63.94 target possible? Technically yes; realistically, probably not. OPEC remains the wild card. Recently the cartel has said it is "comfortable" with price levels, seeing no need to cut production. This has the Brent crude market in a similar downtrend heading for its 61.8% retracement level of $71.42. At some point though, this opinion will likely change sparking renewed buying interest from the noncommercial (investment, speculative, fund, etc.) side of the market.

Comments
To comment, please Log In or Join our Community .