Technically Speaking
Which Top Fits Feeder Cattle Better?
I get a number of interesting phone calls, emails, and messages each week covering a wide variety of market topics. Recently a number of questions have been about the feeder cattle market, not surprising given the dramatic price swings seen this summer.
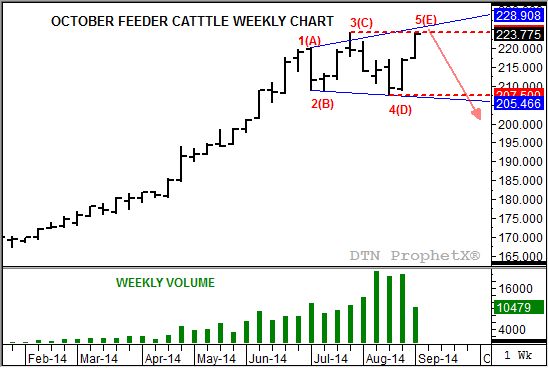
The discussion this time around focused on the possibility of a head-and-shoulders pattern forming in feeder cattle contracts (most notably the more heavily traded October and the next deferred November). When I first glanced at the weekly chart for the October contract, I noticed something that could turn the common head-and-shoulders pattern into the rarely seen five-point top formation.
Let's quickly clarify some terms. First, my analysis is based on John J. Murphy's "Technical Analysis of the Futures Markets", 1986 edition. Definitions in quotes will come directly from this book. Regarding the markings on the chart, the red letters are for the head-and-shoulders pattern while the numbers are for the five-point top. As for the two patterns in question, let's start with what makes a head-and-shoulders top.
P[L1] D[0x0] M[300x250] OOP[F] ADUNIT[] T[]
Before anything else, the market has to have an uptrend. A look at the chart shows this to be the case. From its low of $163.725 the week of October 18, 2013, the October 2014 contract rallied to an initial high of $220.40 (point 1(A)) the week of July 7, 2014. From there the market fell quickly to a low of $208.875 (point 2(B)) that same week. Given the lower weekly close, those familiar with this blog will quickly recognize this as a key bearish reversal, and an early sign that the market was set to change directions.
This led to another rally to a new high of $224.35 (point 3(C)) the week of July 28 before things got really interesting. The next move was to the low of $207.50 (point 4(D)). It is important to note that this is below the 2(B) low of $208.875, raising the question "Is the head-and-shoulders pattern to be, or not to be?" (Sorry, you knew I was going to do that.)
Usually, the neckline of a head-and-shoulders topping pattern (the trendline connecting points B and D) is up. But as Murphy points out, "it's sometimes horizontal and, less often, tilts downward." I had forgotten this last item in my initial analysis of the pattern. A head-and-shoulders top CAN have a descending neckline, it just isn't frequently seen.
This then leaves open the debate as to what type of formation we may be looking at, with the final piece of the puzzle yet to be put in place. If October feeders now move to a new high (point 5), it could be called the rarely seen five-point top. On the other hand, if this rally falls short of the 3(C) high of $224.35 before turning down again, then it is most likely the more common head-and-shoulders pattern. As of early Thursday morning the October contract has posted a weekly high of $224.10.
But wait; is there another way to tell what is going on? Why yes; yes there is.
If we look at weekly trade volume (bottom study, green bars) you'll notice it has been increasing since the contract came on the board almost a year ago. Weekly volume grew from about 11 contracts as the low was posted back in October 2013, to over 21,000 contracts as the market was approaching its point 4(D) low. This is telling, for in a normal head-and-shoulders pattern the high volume should have occurred roughly around the time of the point 1(A) high, with declining numbers seen from there. However, trade volume "tends to expand along with the wider price swings" seen in the five-point pattern. While not a perfect fit, it volume could be viewed as expanding over this course of the last few months, with this week's lower number reflecting only two days of trade.
We need to keep an important point in mind: Livestock futures markets (feeder cattle, live cattle, and lean hogs) continue to be heavily influenced by cash markets, as opposed to grains where futures drive the cash. For this reason, historically, technical signals have not fared well in livestock futures. Add in the potential for a rare pattern in the lightly traded feeder cattle market, and hilarity could ensue.
But this being a blog based on chart analysis, and the subject being feeder cattle, I'm going out on a limb and calling this a five-point top. Not just for the October contract, but for the November and January as well (and, for what it's worth, live cattle).
To track my thoughts on the markets throughout the day, follow me on Twitter:www.twitter.com\Darin Newsom


Comments
To comment, please Log In or Join our Community .