

Technically Speaking
Cash Corn's Long-term Price Patterns

There are times when tracking long-term patterns in the futures market can get confusing. Take for example corn, where September remains the nearby contract while the new-crop December is far and away the more heavily traded. Ask a group of technical analysts which should be plotted on continuous charts, and your likely to get an even split between the two.
To avoid this confusion, I often go back to the intrinsic value of a market to look for chart patterns. In the case of grains, the intrinsic value is the cash value, so I use charts of the various DTN National Indexes (national average cash price).
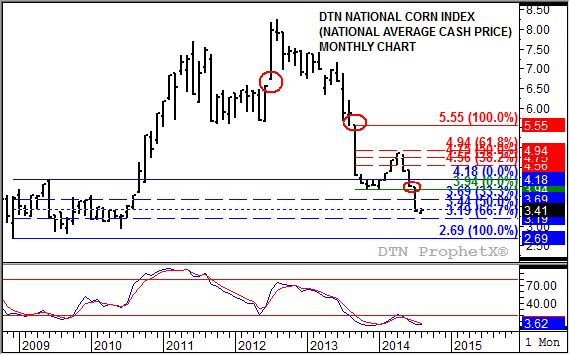
Take a look at the monthly chart for the DTN National Corn Index (NCI.X). Notice the clear patterns it has developed, starting with a series of price gaps dating back to July 2012 when an exhaustion gap formed between $6.57 and $6.73. The cash corn market moved to a new high of $8.26 in August 2012, though its monthly stochastics (second study) were clearly showing bullish momentum had evaporated.
April 2013 saw a bearish breakaway gap form between that month's high of $6.84 and the March 2013 low of $6.99. However, this gap would be filled in June 2013 when the NCI.X posted a high of $7.17, possibly nullifying it as a breakaway gap.
That title could then be bestowed on the next bearish gap that occurred between the August 2013 low of $5.56 and the September 2013 high of $5.55. If you look back to the left on the chart, you'll see this gap was a bearish breakout below a series of lows near $5.60 that occurred from May 2011 through May 2012.
Also note, if you look closely enough, that the NCI.X posted a bearish key reversal in June 2011, in conjunction with a bearish crossover by monthly stochastics above the overbought level of 80%. Chart technicians would argue that this was the true beginning of the major downtrend, despite the fact that the NCI.X would later rally to its high in August 2012.
So what is all this history telling us about the possible future of the cash corn market?
First, if we use the 2013 gap as the bearish breakout point, and assume that the downtrend from that point forward would take the form of a three-wave move (Elliott Wave), Wave A would be from the September 2013 high of $5.55 through the January 2014 low of $3.94 (length of $1.61). The subsequent rally through the April high of $4.86 can be viewed as a Wave B, a move that tested resistance between $4.75 and $4.94. These prices mark the 50% and 61.8% (Fibonacci) retracement levels of Wave A.
P[L1] D[0x0] M[300x250] OOP[F] ADUNIT[] T[]
That means the market is now in Wave C, the final wave, of the major downtrend. Notice that this move has extended from the April 2014 high to a low this month of $3.33, a test of support between $3.44 and $3.19. These prices are the 50% and 67% retracement levels of the major sideways trend between the December 2008 low of $2.69 and the June 2009 high of $4.18, a sideways pattern that continued until the bullish breakout in September 2010. Also note that Wave C includes another gap -- an exhaustion gap perhaps? -- between the June 2014 low of $4.02 and the July high of $3.98.
So will this support hold, or is the NCI.X destined to test its December 2008 low? While it is hard to make a bullish argument for the cash corn market ahead of what is expected to be a record harvest, monthly stochastics might make the case for me. After the NCI.X posted its Wave A low in January 2014, monthly stochastics established a bullish crossover below the oversold level of 20% at the end of February. This momentum indicator then climbed back to near the 20% mark through May before turning down again as Wave C gained strength.
What I'm looking for in monthly stochastics is a secondary, or confirming, bearish crossover below the 20% level. At that time, and with the NCI.X presumably still testing price support, the major (long-term) trend of the cash market should be in the beginning stages of turning up. What is the final signal I'm waiting for? That would be the establishment of a bullish key reversal by the NCI.X. And if not that, then possibly a simple bullish breakaway gap creating the possibility of a bullish island reversal in combination with the 2014 gap mentioned above.
To track my thoughts on the markets throughout the day, follow me on Twitter:www.twitter.com\Darin Newsom
Commodity trading is very complicated and the risk of loss is substantial. The author does not engage in any commodity trading activity for his own account or for others. The information provided is general, and is NOT a substitute for your own independent business judgment or the advice of a registered Commodity Trading Adviser.
Comments
To comment, please Log In or Join our Community .