

Technically Speaking
Grain Markets: Weekly Analysis

Corn: The DTN National Corn Index (NCI.X, national average cash price) closed at $3.33, down 10cts for the week. This is the lowest weekly close for the NCI.X since the week of July 19, 2010. National average basis (NCI.X - September futures) was calculated at 20cts under Friday evening, continuing to run below the 5-year average and unchanged weaker for the week. The combination of weak national average basis while the futures market trades in the lower 10% of the 5-year price distribution range reflects a continued bearish old-crop supply and demand situation. Technically the NCI.X is testing major (long-term) support between $3.44 and $3.19.
New-crop Corn: The December contract closed 9.50cts lower. The secondary (intermediate-term) trend remains down. Weekly stochastics are deep in single digits indicating a sharply oversold situation. The close of $3.62 1/4 has the December contract priced in the lower 10% of the market's 5-year distribution range. Friday's weekly CFTC Commitments of Traders report showed noncommercial traders reducing their net-long futures position by 20,604 contracts. The December to July forward curve shows a bearish level of carry (68% of total cost of carry). Major (long-term) support in the futures market is $3.43 1/4.
Soybeans: The DTN National Soybean Index (NSI.X, national average cash price) closed at $11.80, down $0.44 for the week. The NSI.X is now priced in the lower 33% of its 5-year distribution range, a level that could spark renewed buying attention. Despite losing 20 cents last week, national average basis (NSI.X minus the November futures contract) remains strong at $1.21 over, reflecting the continued tight old-crop supply and demand situation.
New-crop Soybeans: The November contract closed 25.00cts lower. The secondary (intermediate-term) trend remains down as noncommercial traders added another 3,755 contracts to their net-short futures position. Despite weekly stochastics below the oversold level of 20%, the November contract is in position to move below its recent low of $10.55 with last week's close of $10.58 1/2. This puts the contract in the lower 21% of the market's 5-year price distribution range. Major (long-term) support is between $9.91 1/2 and $9.28 1/4, the 61.7% and 67% retracement levels of the uptrend from $4.98 1/2 through the high of $17.89.
Wheat: The DTN National SRW Wheat Index (SR.X, national average cash price) closed at $5.04, down 3.00cts for the week. National average basis was calculated Friday at 30 cents under, still holding near the strongest level for the last five years of 24cts under. The carry in the futures market 2014-2015 has also been weakening, indicating renewed support from the commercial side of the market.
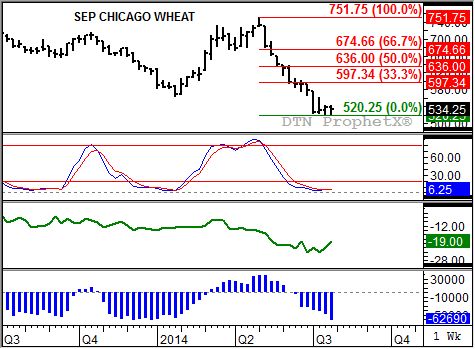
SRW Wheat: The September contract closed 3.75cts lower. Weekly stochastics (second chart) established a bullish crossover well below the oversold level of 20%, indicating a possible change in the secondary (intermediate-term) trend. While the September contract just missed establishing a key bullish reversal (the contract closed lower for the week) the market could begin to stabilize on renewed commercial buying interest, as indicated by the weakening carry in the September to December futures spread (third chart, green line). However, Friday's CFTC report showed noncommercial traders adding another 14,297 contract to their net-short futures position (bottom chart, blue histogram).
The most recent CFTC Commitments of Traders report was for positions held as of Tuesday, July 29.
P[L1] D[0x0] M[300x250] OOP[F] ADUNIT[] T[]
Comments
To comment, please Log In or Join our Community .