

Technically Speaking
Turning Point in Soybean Meal
Like the cattle markets (both live and feeder), soybean meal seems to have nine lives. Every time it looks like it has established a top, it steadies itself and pushes higher. As we come up to another close of a week the July contract is once again indicating a possible bearish turn is in the offing.
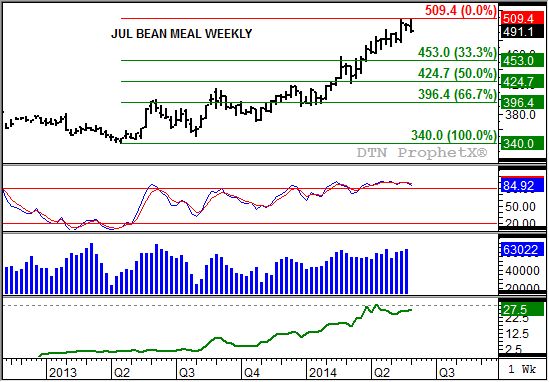
Take a look at the July bean meal weekly chart. Those familiar with this blog will immediately recognize the problem faced July meal after it posted a new high of $509.40 this week, has since fallen below last week's low of $492.70, and is poised to finish well below last week's settlement of $500.20. By definition this is looks to be the establishment of a classic key bearish reversal, indicating the secondary (intermediate-term) trend is turning down.
P[L1] D[0x0] M[300x250] OOP[F] ADUNIT[] T[]
Along with the pattern in the futures market, weekly stochastics (second study) are also showing a possible bearish crossover above the overbought level of 80%. The faster moving blue line (84.9%) has crossed below the slower moving red line (87.5%), and barring a miraculous turn of events should finish the week in this position.
If the trend is indeed turning down, it will likely come from increased noncommercial long-liquidation. Weekly CFTC Commitments of Traders reports (third study, blue histogram) show this group continue to hold a large net-long futures position of just over 63,000 contracts as of last Friday's report (positions as of Tuesday, May 27).
The other side of the market, the commercial side, remains bullish. The July to August futures spread (bottom study, green line) continues to show a strong $27.50 inverse, slightly below the high of $30.60 posted the week of April 13. This view of market fundamentals should continue to provide support, and possibly limit the coming sell-off.
How far could the July bean meal contract fall? Given its market structure of potential noncommercial selling offset in part by a bullish commercial outlook, the initial target is $453.00. This price marks the 33% retracement level of the previous uptrend from the low off $340.00 through this week's high. If the commercial view starts to weaken a bit, it is possible the sell-off could extend to the 50% retracement level of $424.70.
One last note: while this blog looks at the contract's weekly chart, the market's long-term monthly chart is also growing more interesting. Monthly stochastics are at or above the 90% level and poised for a bearish crossover as well at the end of the month. If this happens it could be argued that the major (long-term) trend has turned down as well.
To track my thoughts on the markets throughout the day, follow me on Twitter: www.twitter.com\DarinNewsom

Comments
To comment, please Log In or Join our Community .