

Technically Speaking
The Glacial Advance of the U.S. Dollar Index
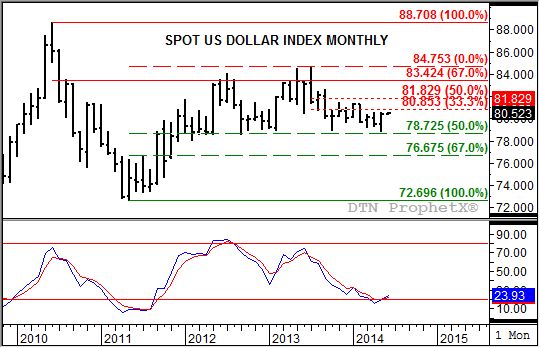
For almost two years now it has been easy to ignore the U.S. dollar index. Its movement over that time has resembled an advancing glacier; a few inches forward followed by a few inches back. The index has been locked in a sideways trend between resistance at 83.424, the 67% retracement level of the previous sell-off from 88.708 (June 2010) through the low of 72.696 (May 2011), and support at 78.725. This price marks the 50% retracement level of the rally from the May 2011 low through the July 2013 high of 84.753. A sidenote: the index has spiked above the previously mentioned resistance line three times (July 2012, May 2013, and July 2013) but was unable to close above on the monthly chart.
In May 2014, the U.S. dollar index just missed establishing a bullish key reversal. It set a low of 78.906, below the previous month's low of 79.330 (and the October 2013 low of 78.998), and tested the April 2014 high of 80.599 with a May high of 80.581 before closing higher for the month. By definition, the bullish key reversal was missed by just under 0.020 (difference between the monthly highs).
P[L1] D[0x0] M[300x250] OOP[F] ADUNIT[] T[]
At the same time, monthly stochastics were nearing a bullish crossover. At the end of April both the faster moving blue line and slower moving red line were at or below the oversold level of 20% (15.4% and 20.2% respectively). By the end of April, the blue line had crossed above the red line (20.21% versus 20.18%) indicating the index is now trending sideways to up, but falling short of establishing an actual bullish crossover (not below the 20% level).
So where does this leave the U.S. dollar index? Given its bullish close to May, and the fact monthly stochastics are now bullish, it seems logical to project a solid rally ahead for the index. Also, the last major signal in monthly stochastics was a bullish crossover below the 20% level back in May 2011. This would indicate that the U.S. dollar index should make another run at resistance near 83.424.
As for commodities, with most of the major markets priced in U.S. dollars, a stronger U.S. dollar index would imply the commodity complex in general should come under pressure. Recently selling has become more widespread with gold, cotton, and grains either locked in downtrends already or indicating downtrends are just beginning. Crude oil and gasoline are also indicating bearish turns while distillates (heating oil) struggles to go anywhere. The outlier, as usual, is natural gas which is indicating a possible bullish turn on its weekly chart.
To track my thoughts on the markets, follow me on Twitter: www.twitter.com\DarinNewsom
Commodity trading is very complicated and the risk of loss is substantial. The author does not engage in any commodity trading activity for his own account or for others. The information provided is general, and is NOT a substitute for your own independent business judgment or the advice of a registered Commodity Trading Adviser.

Comments
To comment, please Log In or Join our Community .