

Technically Speaking
The KC Wheat Puzzle

Anyone who has traded wheat, either futures or cash, knows of the market's mercurial nature. Almost without fail, just when you think you have it figured out, it does the complete opposite. Much of this is due to the fact that, like a cockroach, the crop is nearly impossible to kill and for that reason, the world seldom sees a short-supply scare (say that five times fast). This year's crop/market seems to be following that same pattern.
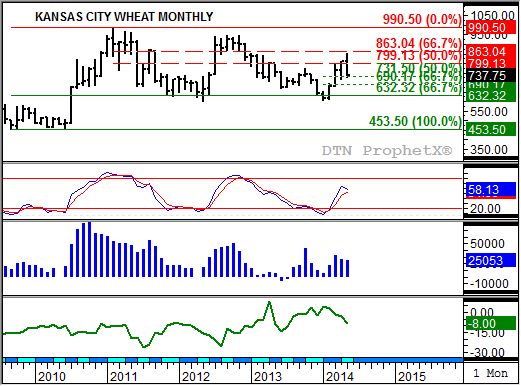
A look at the long-term monthly chart for Kansas City HRW wheat, the largest wheat crop grown in the United States, shows the market is in an uptrend. Going back we see the market established a low of $6.07 3/4 (January 2014), a test of major (long-term) technical support near $6.32 1/4, a price that marks the 67% retracement level of the previous uptrend from $4.53 1/2 (September 2009) through the high of $9.90 1/2 (February 2011). February 2014 saw monthly stochastics (second study) establish a bullish crossover below the oversold level of 20% confirming the idea the major trend had turned up.
P[L1] D[0x0] M[300x250] OOP[F] ADUNIT[] T[]
From there the market quickly rallied through the high this month of $8.55 1/4. Note that this high was a test of resistance near $8.63, the 67% retracement of the downtrend from the February 2011 high through the January 2014 low. Also note that monthly stochastics have only move into the 50% range, meaning this particular technical indicator remains bullish.
So what does that mean for the futures market? Notice that the late May sell-off has pulled the July contract back to near $7.35 (overnight low), just above technical support at $7.31 1/2. This price marks the 50% retracement level of initial rally from the January low through this month's high. However, given the recent strengthening of the carry in the July to September futures spread (bottom study, green line) the market could see an extended sell-off back to the short-term 67% retracement level near $6.90 1/4.
From there the outlook gets a bit murky. If new-crop futures spreads begin to firm, reflecting a more bullish commercial outlook tied to worse than expected HRW production, the market could begin to rally. Seasonally, HRW wheat tends to move higher from early July through late August. However, wheat seasonal index charts do not show as consistent of patterns as they have in the past. Still, unless the recent rain in the Texas Panhandle and parts of Oklahoma did indeed save the crop, technical indicators would imply that the market should see a rally off support in the coming months.
But again, this is wheat, so one never really knows.
To track my thoughts on the markets throughout the day, follow me on Twitter: www.twitter.com\DarinNewsom
Comments
To comment, please Log In or Join our Community .