

Technically Speaking
A Waiting Game in Soybeans
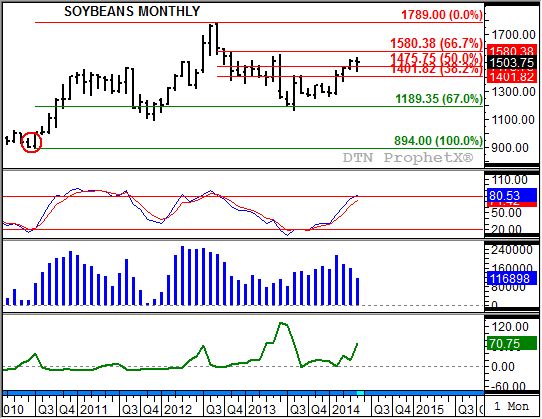
look at the long-term continuous monthly chart for soybeans shows just how important this week's close, also the monthly close, should be for the market. All eyes will be on Friday's settlement in relation the April close of $15.12 3/4.
The month of May has seen the nearby contract take out the April high of $15.21 with a rally up to $15.36 3/4. Also, this past month has seen the nearby contract trade below last month's low of $14.56 with a price of $14.41 3/4. Therefore, a monthly close above the April settlement price would establish a bullish outside month indicating the market should see an extended rally. On the other hand, a lower monthly close would mean a key bearish reversal was posted indicating a move to a major downtrend.
P[L1] D[0x0] M[300x250] OOP[F] ADUNIT[] T[]
What are other technical factors saying about the market? Notice that the May high (at this point) is nearing a test of long-term resistance at $15.49 3/4, a price that marks the 61.8% retracement level of the previous downtrend from $17.89 (September 2012) through the low of $11.62 1/2 (August 2013). At the same time, monthly stochastics (second study) have not yet reached the overbought level of 80%. This would imply that there is time and price space for the market to rally before seeing a change to a major downtrend.
If the market is to rally though, who will be in the driver's seat? It is interesting to note that there is a divergence in the market structure. Noncommercial traders continue to liquidate a portion of their net-long futures position, as indicated by weekly CFTC Commitments of Traders reports (third study, blue histogram). On the other hand, a tightening supply and demand situation has commercial traders continuing to strengthen the inverse in the nearby July to August futures spread (bottom study, green line).
Given the continued bullish commercial outlook, its tendency to rally into late July (according to the five-year seasonal index, not shown), and the fact stochastics are not yet overbought the market would be expected to test the 61.8% retracement level, if not extend slightly to the 67% retracement level near $15.80 1/2. However, with the market already trading in the upper 10% of the five-year price distribution it won't take much persuasion, e.g. rebuilding of U.S. stocks with 2014 crop prospects, to spark increased selling from both commercial and noncommercial interests.
To track my thoughts on the markets, follow me on Twitter: www.twitter.com\DarinNewsom
Commodity trading is very complicated and the risk of loss is substantial. The author does not engage in any commodity trading activity for his own account or for others. The information provided is general, and is NOT a substitute for your own independent business judgment or the advice of a registered Commodity Trading Adviser.

Comments
To comment, please Log In or Join our Community .