

Technically Speaking
July Soybeans: Damage Done
Though traveling Thursday, my phone was abuzz with commentary, questions, and bewilderment over the sharp sell-off in old-crop soybeans. Cutting through the cheerleading that a bearish day brings to social media, the heart of the matter is what really happened and what it means for the market in the weeks to come.
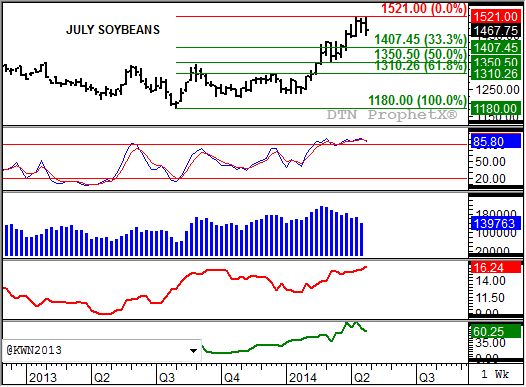
A quick glance at the July soybean weekly chart is all those familiar with this blog need to see to know it looks like trouble ahead for the contract. After testing its previous high of $15.21 this past Tuesday, taking out last week's high of $15.12 1/4, the contract collapsed Thursday to well below last week's low of $14.60 1/2. Barring a bullish miracle of epic proportions, the contract is set to close below last week's settlement ($14.94 1/4) thereby establishing a key bearish reversal.
What's even more compelling about this likely move to a downtrend, is that it is confirmed with a bearish crossover by weekly stochastics (second study). Notice that the faster moving blue line (86%) has moved below the slower moving red line (87%), with both above the overbought level of 80%. This combination should spark continued noncommercial long-liquidation in the soybean market. Recent weekly CFTC Commitments of Traders report show this group's position has been declining over the past number of weeks (third study, blue histogram). This Friday's report could be skewed by the fact that numbers are as of the previous Tuesday as the contract was testing its high.
P[L1] D[0x0] M[300x250] OOP[F] ADUNIT[] T[]
What were some of the key factors that drove the July contract lower? First, its price. When it was trading above $15.20 that put the contract in the upper 8% of the market's five-year price-distribution range. Add to that its market volatility (fourth study, red line) had increased. Generally speaking the combination of an overpriced market and increased volatility tend to spark at sharp sell-off in the near future. It was also this combination that led to the DTN Strategy recommendation, for those knowledgeable of and comfortable with the risks involved, to sell June call options looking to take advantage of a short-term sell-off.
While noncommercial activity was the likely dominant force in Thursday's action, the commercial side also played a role. Notice that the July to August futures spread (bottom study, green line) has seen a weakening of its inverse. While still at a bullish 60 cents, it is in position to extend its recent dip below the previous low (weekly close only) of 68 1/4 cents. This would indicate that the spread, as well as the July futures contract, has likely topped for now and could increase the pressure on the market.
Where might the contract go from here? Keep in mind that despite all the talk of doom and gloom, the inverse in the July to August spread continues to reflect a bullish commercial outlook. That being the case a contract will normally see a retracement of at least 33%, and usually not more than 50% of its previous uptrend. Using those percentages creates a targeted price range between $14.07 1/2 and $13.50 1/2. That seems a rather serious selloff, but we need to keep in mind the previous uptrend began at the low of $11.80 (week of August 4, 2013).
One last thing we need to keep in mind, and I mentioned it in Friday's On the Market column ("Fields of Gold"), and that is the major (long-term) trend on the soybean monthly chart remains up. Long-term price resistance is pegged between $14.75 3/4 and $15.49 3/4. The latter number raises the bigger question of whether or not recent highs were an adequate test to say the market has done its job. I would say no, based on the fact both monthly stochastics and nearby futures spread remain bullish, meaning the market should find renewed support.
To track my thoughts on the markets, follow me on Twitter: www.twitter.com\DarinNewsom
Commodity trading is very complicated and the risk of loss is substantial. The author does not engage in any commodity trading activity for his own account or for others. The information provided is general, and is NOT a substitute for your own independent business judgment or the advice of a registered Commodity Trading Adviser.

Comments
To comment, please Log In or Join our Community .