

Technically Speaking
The US Dollar Index and Grains

While the U.S. dollar index doesn't seem to have the influence on most commodities that it has had in the past, there is still a great deal of interest in what would happen if the greenback continued to weaken. To answer that, we need to have an idea of just how much further the index could slide.
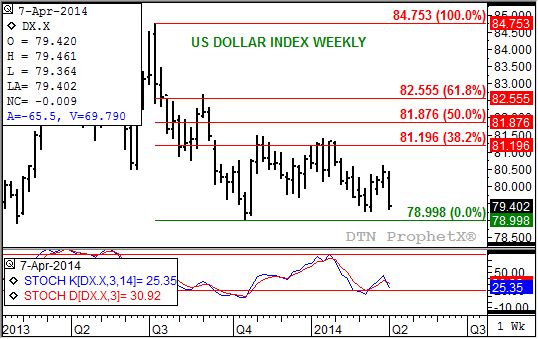
A look at its weekly chart shows the USDX into to be nearing secondary (intermediate-term) technical support, first at its recent series of lows
P[L1] D[0x0] M[300x250] OOP[F] ADUNIT[] T[]
79.280 and 79.268, then at its previous low of 78.998 (week of October 21, 2013). On its long-term monthly chart (not shown) technical support is at 78.725, a level that marks the 50% retracement of the previous uptrend from 72.696 (May 2011) through the high of 84.753 (July 2013). It is interesting to note that this long-term support level held the lows of a consolidation period from September 2012 through February 2013, and the previous mentioned low that occurred in October 2013.
If we look at the DTN National Indexes (national average cash prices) for grains going back to last October; cash corn was near $4.20, cash soybeans near $12.60, and cash SRW wheat near $6.55. By comparison Thursday's calculations had these indexes at $4.68, $14.39, and $6.39 respectively. If we are looking for a connection on the weekly chart, a continued sell-off in the U.S. dollar index would seem to have little effect on cash grains.
However, if we extend our study out to the monthly chart and look at average prices for the DTN Indexes as the U.S. dollar index consolidated near the previously mentioned long-term support (September 2012 through February 2013), the picture is far different. Cash corn averaged approximately $7.30, cash soybeans $14.59, and cash SRW wheat $7.85.
Does this suggest that a dip in the dollar equates to $7.00 corn? Not necessarily.
We need to keep in mind that grains, like most commodities, will be driven by their own underlying fundamentals. Using corn as an example, if demand continues to strengthen and ending stocks tighten as much as USDA projected in its April Supply and Demand report (ending stocks of 1.331 bb, ending stocks to use of 9.9%) then there is a good chance corn continues to extend its recently established major (long-term) uptrend, discussed in the April 1 Technically Speaking blog.
However, if corn demand comes in below current projections, with Q2 stocks implying a 1.475 bb ending stocks figure, then corn could just as easily pull back to projected technical support near $4.63. The bottom line is that the next move in grains probably won't be tied to the U.S. dollar index, but to commercial outlooks shown to us in the futures spreads.
To track my thoughts on the markets throughout the day, follow me on Twitter: www.twitter.com\DarinNewsom
Comments
To comment, please Log In or Join our Community .