

Technically Speaking
The Technically Sound Gold Market

Some of you may know that I take part in a weekly gold market survey put together by Kitco News. This survey compiles opinions of a number of different market analysts, both fundamental and technical, answering the simply questions of "What direction do you see the market going" and "Why". While I don't know the actual makeup of the panel surveyed, there is part of me that believes I, as a technical analyst, am usually in the minority.
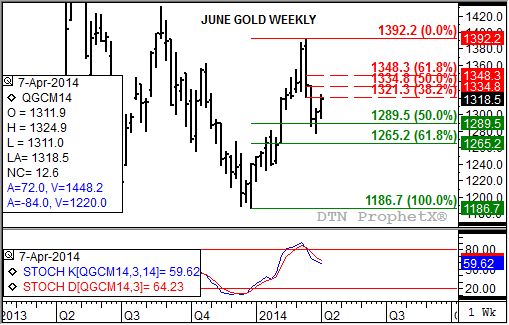
But that may be a point in my favor, for the gold market has been closely following its technical patterns for quite some time. Take a look at the price chart (top study) for the more active June contract. Notice that after it peaked at $1,392.20 (week of March 17, 2014) the contract took out the previous week's low of $1,328.00 before closing lower for the week.
All together now: What pattern does that establish? A BEARISH KEY REVERSAL! Very good, you've done your homework. Anyway, this pattern usually indicates a key turning point, as its name would suggest, with this example being no exception. From that week forward the June gold contract fell to a low of $1,277.40 (week of March 31, 2014) with a low weekly close of $1,294.30.
P[L1] D[0x0] M[300x250] OOP[F] ADUNIT[] T[]
Do you notice anything interesting about those last two prices? Take another look at the weekly chart. The initial sell-off resulted in a 50% retracement of the previous secondary (intermediate-term) uptrend from $1,186.70 (week of December 30, 2013) through the high the week of March 17.
From there, the June contract has rallied to a high of $1,324.90 this week. Again the weekly chart is playing out as expected. Given its history the contract should make a high near $1,334.80, the 50% retracement of the initial sell-off, before turning lower.
Weekly stochastics (bottom study) have also done a good job of indicating changes in trend. Note that when the low of $1,186.70 was established the week after a bullish crossover by stochastics (faster moving blue line crossing above the slower moving red line) below the oversold level of 20%. Subsequently, when the contract established its bearish key reversal, weekly stochastics saw a bearish crossover (faster moving blue line crossing below the slower moving red line) above the overbought level of 80%.
The recent rally in the June contract hasn't created much of a change in weekly stochastics, implying that after the expected test of the 50% retracement level, gold should resume its secondary downtrend. The major (long-term) trend on the monthly chart remains up following a bullish crossover by monthly stochastics this past February, with technical support pegged between $1,287.00 and $1,262.10.
To track my thoughts on the markets throughout the day, follow me on Twitter: www.twitter.com\DarinNewsom
Comments
To comment, please Log In or Join our Community .