

Technically Speaking
May Soybeans: Waiting for the Verdict
In a mere 67 hours or so (from the time this blog was posted) the soybean market will likely have a better idea of which direction it is going. That's how much time (roughly) until USDA releases this year's round of March Quarterly Stocks and Prospective Plantings reports.
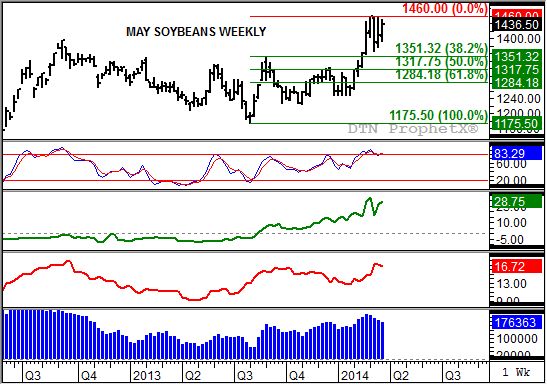
If we look at the charts, can we get a sense of how things might go? Not really. As the weekly chart shows the nearby May contract has spent the last number of week's consolidating below its recent high of $14.60. Meanwhile, noncommercial traders have been trimming their net-long futures position, most recently to 176,363 contracts (bottom study, blue histogram). If this group was confident Monday's reports would be bullish it would stand to reason they would be buying again.
P[L1] D[0x0] M[300x250] OOP[F] ADUNIT[] T[]
The commercial side of the market is also undecided. While the inverse in the May to July spread remains at a stout 28 3/4 cents (third study, green line), it too remains below its peak of 33 cents posted the week of March 2, 2014. If the contract starts to fall after the release of the quarterly stocks numbers, commercial traders may not be strong enough to hold back a flood of noncommercial sell orders.
And though logic would hint at a stronger likelihood of a bullish quarterly stocks report, as discussed in DTN's Report Preview "Stocks Watching", we all know these things are nothing more than a modern day version of pollice verso (Latin for with a turned thumb) with USDA playing the role of Emperor. Does the quarterly stocks number have to make sense or be logical? Everyone can answer for themselves.
Weekly stochastics (second study) show the May contract to be in an overbought situation. Therefore, from a momentum point of view, the market would be expected to turn down. If so initial support is near $13.51 1/4, a price that marks the 38.2% retracement of the previous uptrend from $11.75 1/2 through the recent high of $14.60.
However, what if the report is bullish? Trading so close to the recent high, we need to turn to the long-term monthly chart for perspective (I'll be discussing monthly charts in more detail next week). If by chance quarterly stocks are bullish, the next upside target for soybeans is $14.75 3/4. This price marks the 50% retracement level of the downtrend from $17.89 (September 2012) through the low of $11.62 1/2 (August 2013). Beyond that is the 61.8% retracement mark near $15.49 3/4.
Which way will it go? I'd guess bullish, but again, that's only based on logic and one of the many reasons I don't bet on USDA reports.
To track my thoughts on the markets throughout the day, follow me on Twitter: www.twitter.com\DarinNewsom

Comments
To comment, please Log In or Join our Community .