
Technically Speaking
Corn: Clock Watching and a Coin Toss

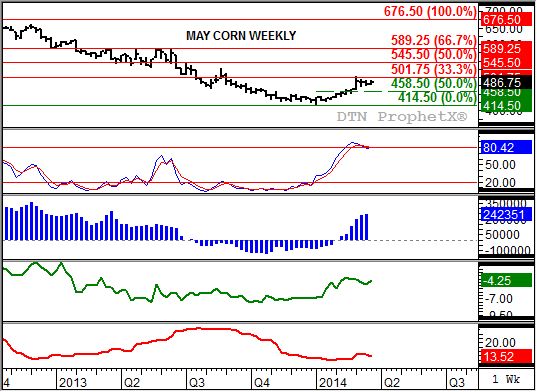
May corn is in a holding pattern just below technical resistance at $5.01 3/4, a price that marks the 33% retracement level of the previous downtrend from $6.76 1/2 through the low of $4.14 1/2. As its weekly trading ranges continue to narrow, the question is what is the market waiting for? Renewed investment trader interest? The March 31 Quarterly Stocks report? Godot?
As for the investment interest, notice that this group has increased its net-long futures position, according to weekly CFTC Commitments of Traders reports (third study, blue histogram). Last Friday's numbers showed this group holding a net-long of 242,351 contracts, the largest net-long position since the same week a year ago. That in and of itself is interesting, showing that once the March Quarterly Stocks report passed in 2013, this group became aggressive sellers.
But what might this year's round of March Quarterly Stocks show? I discuss this at length in DTN's report preview set to be posted early Friday morning. In a nutshell, the risk is that Q2 stocks could come in larger than the pre-report average estimate of 7.11 bb. The market itself continues to show a neutral to bullish view of fundamentals, with the May to July futures spread (fourth study, green line) showing a carry of only 4 1/2 cents, accounting for approximately 34% of full cost of carry.
P[L1] D[0x0] M[300x250] OOP[F] ADUNIT[] T[]
Going back to the weekly price chart on top, the most likely reaction to Monday's report is a breakout of the consolidation pattern dating back to the week of March 2 when the contract posted a high of $5.02 1/2 and a low of $4.64, for a range of 38 1/2 cents. The midpoint of that range is $4.83 1/4, near where the contract is trading ahead of the report.
It has been pointed out on the social media site Twitter that the May contract has made a limit move 4 out of the last 7 years following the March Quarterly Stocks report. I have not researched this particular point so can't absolutely say it is true.
Let's assume a Friday close near resistance at the $5.01 3/4 level. If the report is perceived as bullish and the May contract moves limit up it would find itself testing the next level of price resistance at $5.45 1/2. On the other hand, a limit down move of 40 cents would result in a test of support at $4.58 1/2, the 50% retracement level of the recent rally from the low of $4.14 1/2 through the recent high.
Theoretically, how could one trade this report? Given the low market volatility (bottom study, red line), options could be purchased for what might be undervalued premium costs. And since we don't know what direction the May contract might move, a long straddle is a possible strategy. In other words, if one were so inclined to try and trade a USDA report, an at-the-money call option AND an at-the-money put option could be bought. Following the report volatility would be expected to increase, raising the time value of the option. Then if the market rallies, the call option should increase in value while the put option decreases. The flip side of the coin is if the market goes down the put option would appreciate while the call option depreciates.
Those concerned about the new-crop December contract are facing a similar situation. Like the May, the December contract has been consolidating just below the $5.00 mark. Using short-dated new-crop options, calls and puts based on the December futures contract but expiring in April can be traded.
Remember, these are not recommendations for trade and those who do decide to trade do so knowing there is risk of loss with any position taken. But, from a technical point of view, corn appears to be nearing a breakout, with direction decided by a figurative coin toss.
To track my thoughts on the markets throughout the day, follow me on Twitter: www.twitter.com\DarinNewsom
Comments
To comment, please Log In or Join our Community .