

Technically Speaking
Elliott Waving Goodbye to Apr Live Cattle

Late Wednesday afternoon, I took a call from a customer concerned about the action in both live cattle and feeder cattle. We took the weekly charts apart, and concluded that it indeed was a time of cautious trading. Then, early Thursday morning, another long-time customer pointed me toward the April live cattle chart, wondering if I saw the same pattern he did. As it turns out, we were on the same page.
Most of you know I use a simplistic form of Elliott Wave Theory. It is my belief that the changed dynamics of trade in commodities (e.g. the larger influence of fund trade through algorithms) has led to an evolution in the use of Elliott Wave. Purists will disagree, and that's fine. That's what makes the world go round.
P[L1] D[0x0] M[300x250] OOP[F] ADUNIT[] T[]
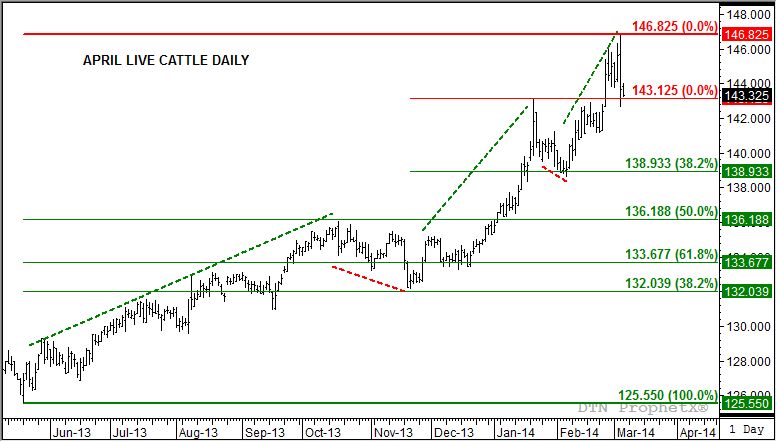
But as I look at the daily chart for April live cattle, I see a clear five-wave uptrend that appears to have peaked with Wednesday's bearish key reversal. Note that the contract moved to a new high of $146.825, fell below Tuesday's low of $144.05 (posting a low of $142.625), then for good measure closed below Thursday's low. Again, as clear cut case of a bearish key reversal that you will see.
But let's back up a bit, what is a five-wave uptrend? As always, I turn to my trusted, and well-worn, 1986 edition of John J. Murphy's classic "Technical Analysis of the Futures Markets". From page 378 (for those of you following along), the characteristic of the first wave it is part of the basing process, often looking more like a minor correction. That doesn't seem to be the case this time around, as the initial rally (first dashed green line) in April live cattle from May 20, 2013 through its initial high of $136.05 on October 17, 2013 was largely unbroken.
The second wave, the sell-off from the October 17 high to the low of $132.15 (first dashed red line) amounted to a test of the 38.2% retracement level ($132.039) of the first rally. The following third wave, marked by the second dashed green line, saw April live cattle rally to a high of $143.125 on January 22, 2014. The fourth wave (second dashed red line) saw the contract fall back to a low of $138.60, again a test of the 38.2% retracement ($138.933) of the third wave. Also note that low of wave 4 ($138.60) did not dip below the peak of wave 1 ($136.05), one of the unbreakable rules of Elliott Wave Theory.
All this set the stage for wave 5 (third dashed green line) that appears to have come to an end Wednesday. If so, recall that a 5-wave uptrend is usually followed by a 3-wave downtrend consisting of a leg down, a retracement, and another leg down. Given the continued bullish market fundamentals of live cattle, indicated by the April to June futures spread, the 3-wave downtrend should find support between the 38.2% retracement and 50% retracement levels of the previous 5-wave uptrend.
Look at where that support is pegged. The 38.2% retracement level of the uptrend from the May 2013 low through this week's high of $146.825 is $138.698, near the 38.2% retracement level of wave three that supported the low of wave 4. Furthermore, the 50% retracement level of the 5-wave uptrend is $136.188, close to the top of the previous wave 1 ($136.05).
To track my thoughts on the markets throughout the day, follow me on Twitter: www.twitter.com\DarinNewsom
Comments
To comment, please Log In or Join our Community .