

Technically Speaking
Bean Meal Set to Stretch its Legs
There is something to be said for the relative clarity of monthly charts. Gone is much of the clutter seen on daily and weekly studies, giving us a clearer picture of what the long-term price patterns could be. And of the monthly charts I look at, soybean meal seems to be one of the cleanest I've seen in a while.
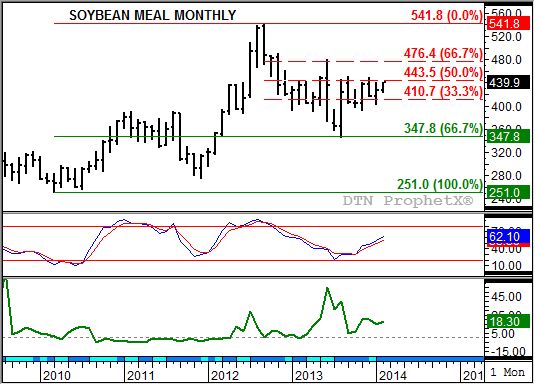
Starting with the price chart itself (top chart) notice that soybean meal has been trending sideways since the bullish key reversal in August 2013. As for this pattern (bullish key reversal), it offset a bearish outside month established in June 2013. Also, note that the low this past August ($345.30) was a strong test of long-term support at $347.80, a price that marks the 67% retracement level of the previous major (long-term) uptrend from $251.00 (low from March 2010) through $541.80 (the high from September 2012).
The consolidation pattern since last August has seen the nearby contract stay within the $410.00 to $450.00 range, or roughly between the 33% ($410.70) and 50% ($443.50) retracement levels of the sell-off from the September 2012 high through the August 2013 low.
P[L1] D[0x0] M[300x250] OOP[F] ADUNIT[] T[]
Meanwhile, monthly stochastics (second study) show the sideways trend should continue as the recent rally occurred before this technical indicator moved below the oversold level of 20%. Stochastics would not be expected to increase to just short of the overbought level of 80% before turning down again.
To get this type of increase in monthly stochastics (currently calculated near 62% and 55%) the nearby futures contract would be expected to extend its rally to the 67% retracement level of $476.40. Support for such a move could continue to come from commercial traders, as indicated by the still strong inverse in the nearby futures spread of more than $18.00 (bottom study). Resistance in the nearby futures spread is at the high monthly close of $20.70 (December 2013).
Noncommercial traders could also provide support, though monthly CFTC Commitments of Traders numbers (not shown) show this group maintaining a net-long futures position of approximately 45,000 contracts. If the nearby futures spread moves above its previous high monthly close, increased noncommercial buying interest could also be seen.
It is also interesting to note that the weekly chart for the nearby March futures contract (not shown) shows (as of Tuesday, February 4) a triple-top formation with highs of $440.40, $440.20, and $440.70. The interim low between the first two peaks was $403.40. Using the average of the first two highs ($440.30) minus the interim low ($403.40) gives us a range of $36.90. If this move sees the March contract clearly break the $440.40 high, we could add the previous range ($36.90) to the breakout establishing a possible price target of $477.30. Recall that this is near the previously mentioned major target of $476.40.
To track my thoughts on the markets throughout the day, follow me on Twitter: www.twitter.com\DarinNewsom

Comments
To comment, please Log In or Join our Community .