

Technically Speaking
Soybeans: "Stuck in the Middle" (Long-term)
If you go back to Friday's post "Trend Table Update", you'll see an oddity in the soybean market. Every trend (minor, secondary, major) for both futures and futures spreads, so six total, is sideways. The most logical conclusion? Soybeans simply don't know which direction to go, staying stuck in the middle for the time being.
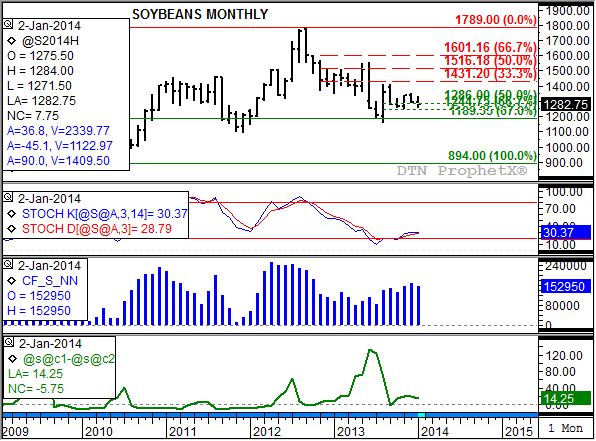
The monthly price chart (top chart) shows the monthly close for the nearby March contract of $12.82 3/4 holding above technical price support at $12.44 3/4, a price that marks the 67% retracement level of August 2013 range from $11.62 1/2 to $14.09 1/2. In fact, sticking with the "Stuck in the Middle" theme, January's settlement is close to the midpoint of last August's range at $12.86.
Why the focus on August 2013? That was the month the soybean market established a major (long-term) bullish key reversal indicating the trend of the market had likely turned up. Note that the nearby contract posted a new low for its ongoing downtrend, rallied to easily surpass the July 2013 high of $12.97, and closed sharply higher for the month ($1.51 1/4). At the time the logical conclusion was that the market was set to post a strong retracement rally, and with the nearby futures spread still inverted (bottom study, green line), the upside target was between a 50% retracement ($15.16 1/4) and a 67% retracement ($16.01 1/4).
But there was a problem. Some of the move in August was due to the inverse in the nearby spread, at the time the August to September, as the August contract expired and the lightly traded September took over the role of nearby contract. This skewed the continuous chart somewhat.
For a better read on the soybean market, one can turn to the DTN National Soybean Index (national average cash price) monthly chart that isn't influenced by spreads and rolling futures contracts. While this past August showed a solid rally, it did not establish the same bullish key reversal seen on the futures chart, so the consolidation that has occurred since isn't as surprising. It is also interesting to note that on the monthly NSI.X chart, stochastics are nearing a possible bullish crossover below the oversold level of 20%, something that futures market (second study) wasn't quite able to do.
The bottom line is this, with noncommercial traders not adding to their net-long futures position (third study, blue histogram) and the nearby futures spread holding in a sideways pattern near 14 cents (bottom study, green line), the soybean futures market could continue to consolidate or slide lower. Seasonally (not shown), soybeans come under pressure from early February through mid-March due to the South American harvest. But if a bullish turn is signaled in the cash market (DTN National Soybean Index, NSI.X), the market may not move lower for long.
To track my thoughts on the markets throughout the day, follow me on Twitter: www.twitter.com\DarinNewsom
P[L1] D[0x0] M[300x250] OOP[F] ADUNIT[] T[]

Comments
To comment, please Log In or Join our Community .