

Technically Speaking
Short-Term Signs of Life in March Corn

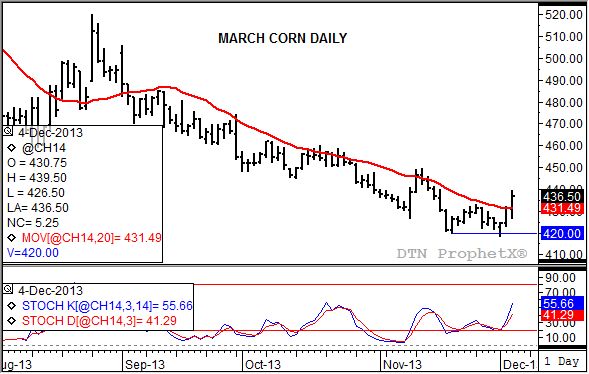
I've talked a number of times recently about the stiff resistance the corn market has met at its 20-day moving average. The couple of times a contract has breached this line over the last many months, raising hopes of a possible bullish breakout, sellers have rushed in to fill the hole. Wednesday's close of $4.36 1/2 was the sharpest break of this resistance in months, the 20-day moving average was calculated near $4.31 1/2, possibly giving the market enough momentum to finally extend its move.
P[L1] D[0x0] M[300x250] OOP[F] ADUNIT[] T[]
If it does, it will confirm the establishment of a minor (short-term) uptrend indicated by the bullish crossover of daily stochastics back on November 8. That day saw the March contract post a bullish key (at the time) reversal on its daily chart, leading to the faster moving stochastic (blue line) cross above the slower moving red line. However, the contract failed to generate continued buying interest, ultimately moving to a new low of $4.18 1/2 this past Monday.
But this time looks different, like the contract may actually be able to build some bullish momentum. With the March contract priced near the lower-third of the 5-year price distribution range, it is possible noncommercial traders could view the market as undervalued, leading to a round of short-covering. As discussed in previous blogs, a similar situation was seen in Chicago wheat recently, leading to a solid, yet short-lived rally.
To track my thoughts on the markets throughout the day, follow me on Twitter: www.twitter.com\DarinNewsom
Comments
To comment, please Log In or Join our Community .