

Technically Speaking
"If You Give a Mouse a Cookie" Corn Could Turn Bullish Again
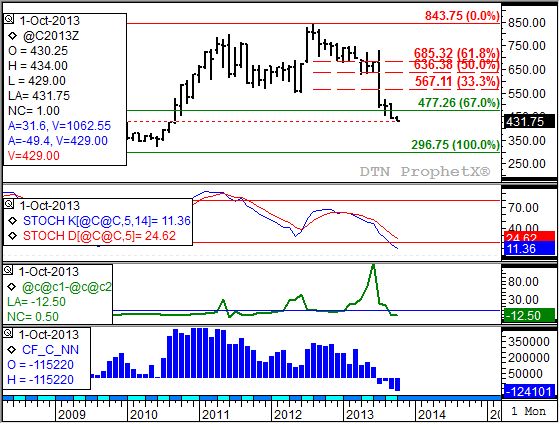
As another month nears its end the long-term (monthly) chart for corn holds few surprises. It takes no special skill as an analyst to see that that the market remains in a downtrend. The most obvious signal is that the futures market (top chart) continues to move lower with the nearby December contract posting a low of $4.29 early Tuesday (October 29) morning. This price hasn't been seen since September 2010 when the nearby contract had a low of $4.23 1/4.
Next up is monthly stochastics (second study) that remain above the oversold level of 20%. While the market could rally before a bullish crossover (faster moving blue line moves above slower moving red line) is established in stochastics, such a pattern necessarily signal a long-term change in trend.
P[L1] D[0x0] M[300x250] OOP[F] ADUNIT[] T[]
Those of you familiar with my analysis know I tie trend (price direction over time) to noncommercial activity. The bottom study plots numbers from CFTC Commitment of Traders reports showing the noncommercial net-futures position (long futures minus short futures). Notice that as corn first established a top in late spring 2011, the net-futures position was long about 500,000 contracts. When the secondary high was established in the summer of 2012, this position had already been whittled down to a net-long of about 290,000 contracts. As this month draws to a close, this same group now holds a net-short (more sold contracts than bought contracts) futures position reportedly near 124,100 contracts. This is a switch of about 625,000 contracts, or 3.25 billion in terms of bushels.
What could turn this group bullish again? There are a couple of possibilities, both having to do with fundamentals. First, commercial traders (those involved with the actual cash commodity) need to build a more bullish view of supply and demand. The nearby futures spread (third study, green line) also shows a solid downtrend reflecting a move from a strong inverse (nearby contract higher priced than the next deferred contract) to a solid carry (nearby contract lower priced than the next deferred). This indicates an increasingly bearish view of supply and demand since June 2013.
Given all the talk of record U.S. corn production and questionable growth in demand, why would commercial traders start to buy? A look at the five-year price distribution chart (not shown) shows the Dec contract nearing the lower-third of the range (based on weekly closes). If simply supply and demand theory holds true, then low prices should increase demand, possibly sparking renewed commercial buying interest and ultimately noncommercial short-covering.
And if that sounds to you like an "If You Give a Mouse a Cookie" scenario, you aren't alone. A number of things have to happen to build a bullish argument in corn again, with any one of them sending the market back to "Go" without collecting $200.
To track my thoughts on the markets throughout the day, follow me on Twitter: www.twitter.com\DarinNewsom

Comments
To comment, please Log In or Join our Community .