

Technically Speaking
Dec Corn Builds on Bullish Signals
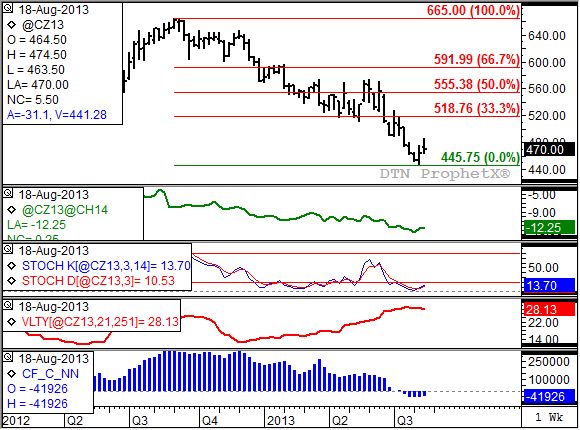
As discussed in this week's On the Market column (Shoot the Moon), the December corn contract appears to be holding a bullish hand. Its weekly chart shows that the contract has the potential to rally, though gains could be limited by both commercial and noncommercial traders.
First, note the price pattern on the top chart from a week ago. Activity the week of December 12 saw the contract fall to a new low of $4.45 3/4, then rally well above the previous week's high of $4.65, before closing higher for the week. This established a key bullish reversal that coincided with a bullish crossover posted by weekly stochastics (third study). A bullish crossover is where the faster moving blue line crosses above the slower moving red line with both below the oversold level of 20%. This is generally viewed as a signal of a move to an uptrend.
P[L1] D[0x0] M[300x250] OOP[F] ADUNIT[] T[]
This week saw the December contract extend its gains early in the week, before pulling back from its high late. This is a pattern that will most likely be repeated often in the coming weeks given the cautious pace of short-covering by noncommercial traders (blue histogram, bottom study) and a carry in the December to March futures spread that continues to indicate a neutral commercial outlook.
The neutral structure (trend of the futures, trend of the futures spreads) indicates the possible rally could take the contract to a test of resistance between $5.18 and $5.55. These prices reflect the 33% and 50% retracement levels of the previous downtrend from the weekly high of $6.65 (week of September 2, 2012) through last week's low. However, the long-term monthly chart (not shown) shows technical price resistance near $5.83, meaning the December contract could possibly stretch its rally to the 67% retracement level near $5.92.
Again, this seems unlikely unless a bullish change is seen in the trend of the futures spreads. And the most logical catalyst for that would be an early freeze across the U.S. Corn Belt, or an extended to dry period to close out the growing season.
To track my thoughts on the markets throughout the day, follow me on Twitter: www.twitter.com\DarinNewsom

Comments
To comment, please Log In or Join our Community .