

Technically Speaking
Into the Gap with July Corn
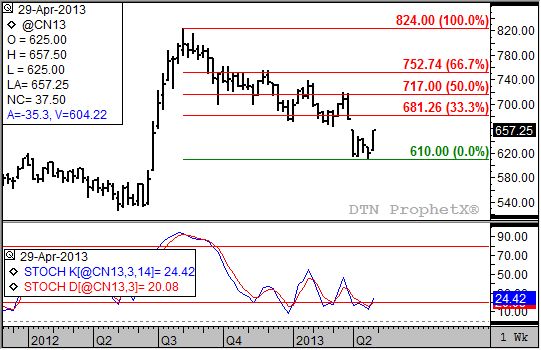
The July corn contract has been stagnating recently, posting a new low of $6.10 as recently as last week. However, as Monday's session progresses the contract is posting an impressive rally of 35 cents for the day, 45 cents off last week's low, and putting itself in position to possibly close a price gap over the next few weeks.
The contract's weekly chart shows a low of $6.76 posted the week of March 25, 2013. The following week, the contract continued to freefall, posting a high of only $6.57 1/4. The area where no trade occurred ($6.76 to $6.57 1/4) represents a "price gap" on the weekly chart. An old market thought simply states, "Gaps are generally filled."
P[L1] D[0x0] M[300x250] OOP[F] ADUNIT[] T[]
Price gaps are analyzed in three classifications. First is the breakaway gap. This tends to occur after at the beginning of a new trend. The runaway (or measuring gap) is usually seen in the middle of a trend. Last but not least is the exhaustion gap that occurs at the end of a trend. If an exhaustion gap is quickly followed by a new breakaway gap, an important turn formation called an Island Reversal is created.
In the case of July corn, it seems we are dealing with a possible exhaustion gap. The contract has been in a consistent downtrend since early August 2012, a reading confirmed by the corresponding bearish crossover by weekly stochastics (bottom study, faster moving blue line crossed below the slower moving red line with both above 80%). The contract moved into a consolidation phase, with Monday's move threatening a bullish breakout.
If July corn can get above the low end of the price gap ($6.57 1/4), it is a strong possibility it will look to close the gap in the coming weeks. Notice that an extension of its rally to the high end ($6.76) would result in a test of resistance at $6.81 1/4, a price that marks the 33% retracement level of the previous downtrend from the August high of $8.24 through the recent low of $6.10. Depending on how fast stochastics move toward the overbought 80% level, the contract could extend its rally to the 50% retracement of $7.17.
One last thing in regards to weekly stochastics: The July corn contract did see a bullish crossover (faster moving blue line crossing above slower moving red line below the oversold level of 20%) indicating a move to a possible secondary (intermediate-term) uptrend. However, it isn't this week's move (creating a secondary bullish crossover above 20%), but the one that occurred the week of January 7, 2013. The subsequent choppy pattern seen in stochastics since then reflects a market that seemed to be battling itself, keeping the trend sideways to down.
It's possible this move will turn out to be more of the same if July corn fails to move above the $6.57 1/4 level. As of this writing, it is trading equal to that price.
To track my thoughts on the markets throughout the day, follow me on Twitter: www.twitter.com\DarinNewsom

Comments
To comment, please Log In or Join our Community .