

Technically Speaking
March Chicago Wheat Turns Up

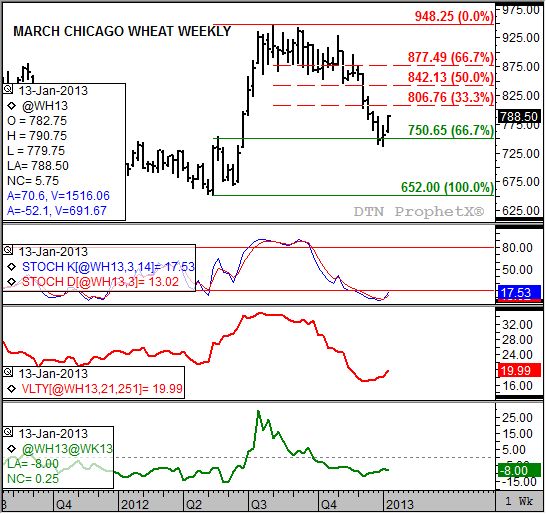
Continuing on with the look at the changing grain complex, March Chicago wheat is showing a similar pattern to what was discussed in corn Monday and Tuesday. But, as is its nature, wheat had to throw a head fake into the mix before turning to an uptrend.
Looking at its weekly chart, the March Chicago contract spent the last two week’s testing longer-term technical support at $7.50, a price that marks the 67% retracement level of the previous uptrend from $6.52 through the high of $9.48 1/4. Notice though that the close the week of December 30, 2012 was at $7.47 1/4, before posting a low of $7.36 1/4 prior to the release of USDA’s January reports last week. As has been well documented, the contract turned on its heels Friday afternoon setting the stage for a possible move to an uptrend this week.
P[L1] D[0x0] M[300x250] OOP[F] ADUNIT[] T[]
It had been discussed for weeks leading into the report that March Chicago wheat was giving signs of a coming uptrend. Weekly stochastics (second study) were in a sharply oversold situation with both the faster moving blue line and slower moving red line moving to single digits (last Friday’s close showed them at 8.1% and 8.5% respectively). At the same time, market volatility (third study, red line) was low but starting to slowly move higher. Also, weekly CFTC reports had noncommercial traders holding a net-short futures position that had grown to almost 21,000 contracts (chart not shown). These three factors indicated the market was primed for a round of short-covering buying.
This week has seen stochastics establish a bullish crossover, as expected, with the blue line now above the red line with both still below 20%. Given that the carry in the March to May futures spread (bottom study, green line) remains stout at about 8 cents the initial rally in March Chicago wheat could be limited to between $8.06 and $8.42, prices that mark the 33% and 50% retracement levels of the previous downtrend from $9.48 1/4 through last week’s low. Seasonally (weekly close only) the Chicago wheat market tends to post its high the first week of February before equaling that high the close of the second week of March.
To track my thoughts on the markets throughout the day, follow me on Twitter: www.twitter.com\DarinNewsom
Comments
To comment, please Log In or Join our Community .