

Technically Speaking
Bullish Signals In March Corn

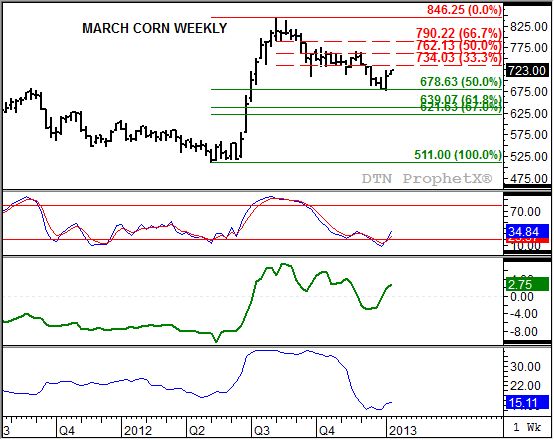
The March corn contract has established technical signals indicating it is belatedly moving into its seasonal uptrend. On its weekly price chart (top chart) the contract posted a bullish key reversal last week as it traded below the previous week’s low, above the previous week’s high, and close higher for the week (and above the previous week’s high). Also note that last week’s low of $6.78 was a test of technical price support at the 50% retracement level of the previous uptrend from $5.11 through the high of $8.46 1/4.
The move to a seasonal uptrend seems to be confirmed by weekly stochastics (second study) as well. Last Friday’s close saw the faster moving blue line move above the slower moving red line, with both below the oversold level of 20%. This offsets the bearish crossover (blue line moving below the red line above the overbought level of 80%) back in August 2012 and should reflect increased noncommercial buying interest.
It has been expected for a number of weeks that this group would become more interested in corn given the low market volatility (fourth or bottom study). Since early December weekly market volatility in corn has been below 15%, a situation investment traders tend to view as an opportunity for new buying, particularly if a market shows bullish fundamentals.
P[L1] D[0x0] M[300x250] OOP[F] ADUNIT[] T[]
Fundamentally, the commercial outlook for corn has grown more bullish in recent weeks. At roughly the same time as volatility hit its low, the downtrend in the March to May futures spread (third study, green line) stabilized at a weak carry of about 3 cents. Since then the trend has turned up again with Monday morning showing the spread near a 3 cent inverse (March priced above the May contract).
The combined factors of a move to an uptrend in both the futures market (noncommercial traders) and the March to May futures spread (commercial traders) indicates a more bullish structure in corn. Given the strength of market fundamentals (futures spreads), the March corn contract should see at least a 50% to 67% retracement of its previous downtrend from $8.46 1/4 through last week’s low. This puts the initial price target range between $7.62 and $7.90. However, given the long-term sideways trend on corn’s monthly chart the market could ultimately test the 2012 high of $8.49.
It’s interesting to note that the five-year seasonal index (not shown but available in DTN’s Pro service) shows the market tends to rally 25% from its normal seasonal low the close of the first week in December or 12% from the low the close of the first week in January through close the second week of June. Using this year’s seasonal low weekly close of $6.80 the first week of January 2013, the seasonal price targets would be near $7.61 and $8.50. These prices equate to a 50% retracement of the previous selloff on monthly chart (high of $8.49, low of $6.78) and a full retracement back to the previous high. The deciding factor as to which resistance level is tested should be the action in the futures spreads.
To track my thoughts on the markets throughout the day, follow me on Twitter: www.twitter.com\DarinNewsom
Commodity trading is very complicated and the risk of loss is substantial. The author does not engage in any commodity trading activity for his own account or for others. The information provided is general, and is NOT a substitute for your own independent business judgment or the advice of a registered Commodity Trading Adviser.
Comments
To comment, please Log In or Join our Community .