
Technically Speaking
Jan Beans' Bullish Signal
There is no denying that Jan soybeans closed the last week of November under pressure, giving market bears a good feeling heading into winter (my unofficial calendar has winter beginning the first of December, lasting through the end of February). But, this group may not want to hibernate too soundly given some of the technical signals that were triggered despite the selloff.
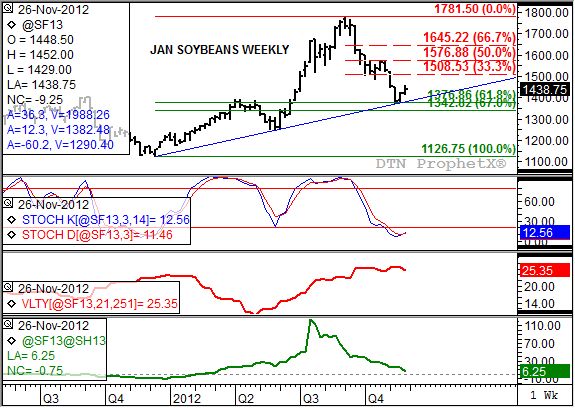
A look at the Jan beans weekly chart shows the contract did indeed stumble to a close of $14.38 3/4 after posting a weekly high of $14.60 (top chart). However, weekly stochastics (market momentum, second study) show the establishment of a bullish crossover indicating the trend of the market has turned up. A bullish crossover occurs when the faster moving blue line crosses over the slower moving red line with both below the oversold level of 20%. In this case, the blue line settled at 12.56% with the red line at 11.46%. The last time a bullish crossover was seen was back in mid-December 2011. Since then the last crossover had been a bearish crossover (both lines above 80%) in early September 2012 that coincided with the peak in the contract at $17.81 1/2.
If the contract were to begin an uptrend it would be in line with the market’s five-year seasonal index (not shown). This index shows soybean futures post an initial rally of about 15% from late October through mid-January. This year, the futures market appears to have set its low (weekly close) in late November at $13.83 3/4. Applying the rally indicated by the seasonal index puts the target price near $15.90, though not for the Jan contract but the March. Interestingly enough, the March contract is showing the same bullish crossover in weekly stochastics and the $15.90 target price would be in line with the contract’s 61.8% (Fibonacci) retracement level of its selloff from a high of $17.28 1/4 through the recent low of $13.56.
While signals are nice, in order for soybeans to actually move into this seasonal rally the market will need to see renewed buying interest from one or both sides (commercial, noncommercial). Commercial traders have actually grown less bullish of late, as indicated by the downtrend in the Jan to March futures spread (fourth study, green line). The inverse in this spread closed the month of November at its lowest point, 6 1/4 cents, since early March 2012. On the other hand, the March to May inverse (not shown) closed at a still robust 22 3/4 cents meaning the market has long-term commercial support.
As is usually the case though, a possible uptrend will come down to noncommercial buying interest. Trends tend to not change until this group changes its opinion, and for not that has been one of continued liquidation. Friday’s CFTC Commitments of traders report showed the noncommercial net-long futures position decreasing another 11,830 contract as they liquidated about 4,900 long contracts and added about 6,900 short contracts (as of the week ending Tuesday, November 27). This group tends to not get overly excited about buying if market volatility is high, the case still seen in soybeans (third study, red line). However, given the long-term bullish commercial outlook and the crossover in weekly stochastics, noncommercial traders could start to view this market with more bullish eyes over the winter.
Commodity trading is very complicated and the risk of loss is substantial. The author does not engage in any commodity trading activity for his own account or for others. The information provided is general, and is NOT a substitute for your own independent business judgment or the advice of a registered Commodity Trading Adviser.
P[L1] D[0x0] M[300x250] OOP[F] ADUNIT[] T[]

Comments
To comment, please Log In or Join our Community .