

Technically Speaking
July KC Wheat Growing More Bullish

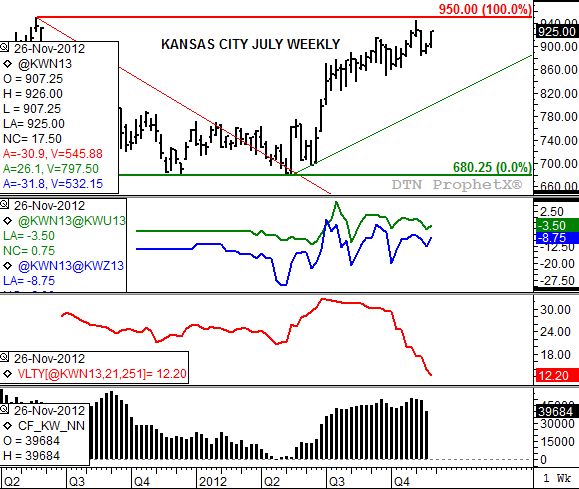
Sometimes there is no denying the direct link between fundamentals and technical signals. Such is the case in Kansas City wheat, where the new-crop July contract is making a run toward its high of $9.50 established the week of May 23, 2011 when volume and open interest were both much lower.
Why is the contract finding renewed buying interest despite its high price? The answer lies in idea that the 2013 HRW crop condition continues to go down due to the ongoing drought across the Southern Plains. For what it’s worth, the last NASS weekly crop condition report for the year was released Monday, November 26 with its numbers resulting in a DTN Crop Condition Index rating for HRW of 78 points. This is the lowest fall numbers on record, setting the stage for more talk of reduced production next summer over the winter when there is little else to discuss.
P[L1] D[0x0] M[300x250] OOP[F] ADUNIT[] T[]
Concern over fundamentals, from a technical point of view, is also reflected in the trend of the futures spreads (middle study). While both the July to September (green line) and July to December (blue line) remain in a carry situation, the premium held by the deferred contract is decreasing, reflected in the slight uptrend seen to the right hand side of the chart. An uptrend in the spreads, decreasing carry, is an indication that commercial traders are growing more concerned over the long-term supply and demand picture.
The other side of HRW market structure (recall that every market has two sides: commercial and noncommercial) could be where bullish momentum could soon emerge. According to the latest CFTC Commitments of Traders report, noncommercial traders hold a net-futures position of just under 40,000 contracts (bottom study, black histogram), with the long futures position roughly 56,000 contracts. Given the low volatility of the contract (third study, about 12.1%) noncommercial traders could become more interested buyers, particularly if the spreads continue to trend up.
A final technical point: notice that the contract has been in all three trends. After posting its high of $9.50 it moved into a solid downtrend (top chart, thin red line). It then moved into a consolidation phase, or sideways trend, until it posted a bullish key reversal the week of May 14, 2012 as it established its low of $6.80 1/4 before rallying to a much higher close of $7.61 3/4. Since the establishment of that bullish turn signal there has not been an offsetting bearish reversal, keeping the market in a solid uptrend (thin green line).
To track my thoughts on the markets throughout the day, follow me on Twitter: www.twitter.com\DarinNewsom
Commodity trading is very complicated and the risk of loss is substantial. The author does not engage in any commodity trading activity for his own account or for others. The information provided is general, and is NOT a substitute for your own independent business judgment or the advice of a registered Commodity Trading Adviser.
Comments
To comment, please Log In or Join our Community .