

Technically Speaking
A Top in Natural Gas

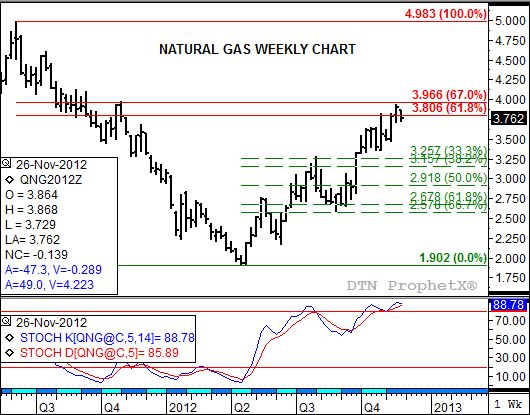
As its weekly chart indicates, natural gas has posted an impressive rally since hitting an almost 11 year low of $1.902 this past April. However, as the old saying goes, all good things must come to an end. In this case, for natural gas market bulls at least, the good times enjoyed during one of the strongest rallies since 2009 seems to be nearing its conclusion.
The weekly chart (top study) shows that the spot-month contract has been testing price resistance between $3.806 and $3.966, prices that mark the 61.8% and 67% retracement levels of the previous downtrend from $4.983 to the above-mentioned low of $1.092, over the course of the last month or so. Last week saw the contract post a high of $3.933, its highest price in over a year (dating back to October 2011).
Meanwhile, weekly stochastics (bottom study) show the natural gas market to be in a sharply overbought technical situation, with both the faster-moving blue line and slower-moving red line well above 80%. This increases the potential for a possible bearish crossover, the blue line moving below the red line above 80%, indicating a bearish turn in momentum at the same time as the spot-month contract falls back from its test of longer-term technical price resistance.
If the trend of the market does turn down it will be due to increased noncommercial selling as this group begins to rebuild its net-short futures position. If so, and given the neutral commercial outlook indicated by the near flat forward curve, the market could see a 33% to 50% retracement of this uptrend putting initial support between $3.257 and $2.918.
"To track my thoughts on the markets throughout the day, follow me on Twitter: www.twitter.com\DarinNewsom
P[L1] D[0x0] M[300x250] OOP[F] ADUNIT[] T[]
Comments
To comment, please Log In or Join our Community .