

Technically Speaking
Fuzzy Signals in March Wheat

Those familiar with this blog know I’m originally from Kansas, also known as The Wheat State (putting aside the Land of Oz for now). Still, with all my years of watching wheat charts and trading the commodity both cash and futures, it remains one of the markets most difficult to get a handle. It could be because there are so many nuances to the market that corn and soybeans, or most any other commodity, don’t have.
To begin with, simply saying you are going to look at wheat opens up a plethora of possibilities. Will it be SRW (Chicago), HRW (Kansas City), or HRS (Minneapolis)? Is it going to be old-crop or new-crop? Cash or futures? If cash, one could include durum and white wheat in the mix by studying charts of the DTN National Indexes (national average cash prices) for these cash markets. Or is it a spread between two or more of the markets? For instance, if you wanted to study the trend in protein premium for winter wheat, you would look at the difference between the Minneapolis futures or cash market minus the Kansas City futures or cash market.
P[L1] D[0x0] M[300x250] OOP[F] ADUNIT[] T[]
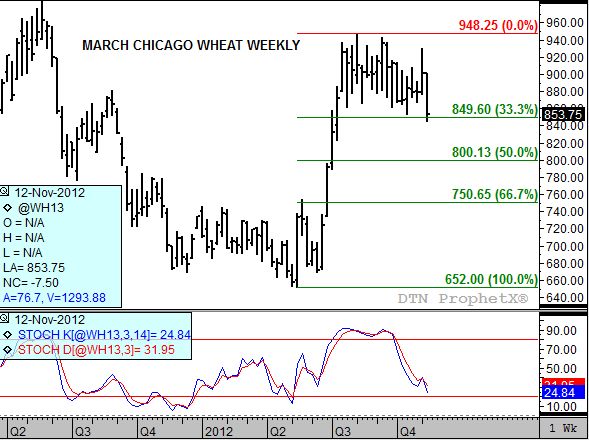
In additional to all of that, one should also be familiar with the little personality quirks the wheat market has. One of the more telling is on display in the attached March Chicago wheat weekly chart and known as a “head fake”. Wheat is well known for either moving above resistance or below support before immediately turning back the other way. That’s why when you think you see a technical signal in the wheat market you better wait for confirmation before getting too carried away.
This past week saw the March Chicago contract dip below support near $8.49 1/2, a price that represents the 33% retracement level of the previous uptrend from $6.52 through $9.48 1/4 before closing back above this price for the week. Meanwhile, weekly stochastics continue to work toward oversold at the 20% level. At first glance the market would see poised to continue its downtrend, in line with its seasonal tendency (not shown), possibly to the 50% retracement level near $8.00.
Notice that the last time the Chicago wheat market turned up it did so with the actual bullish crossover in stochastics above 20% in conjunction with a bullish key reversal on the weekly chart (mid-May 2012). Stochastics had moved below the 20% level just prior to that, so momentum could be key to a possible turn once again.
One last thing to keep in mind: the market has been growing a bit more bearish fundamentally, as indicated by the slight strengthening of the carry in the March to May futures spread (again, not shown). But, the May contract is a hybrid that doesn’t really know what it is – old crop or new – so can often be skewed in relation to either the March of July contracts.
In general wheat continues to look bearish, but should be traded cautiously. While technical signals point to a continued downtrend keep a close eye on both the stochastics and the spreads for early signs of a bullish change in sentiment.
ITo track my thoughts on the markets throughout the day, follow me on Twitter: www.twitter.com\DarinNewsom
Comments
To comment, please Log In or Join our Community .