

Technically Speaking
Jan Beans' Downtrend

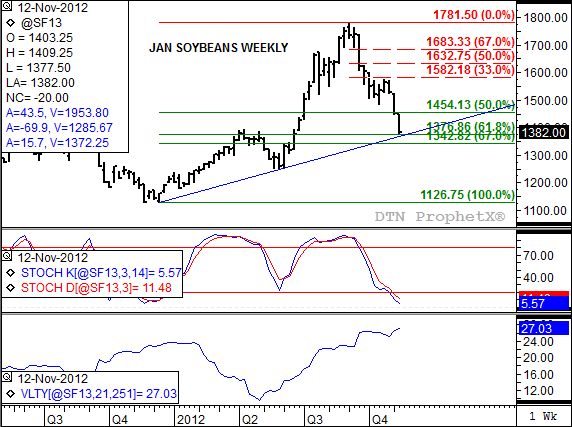
Those of you who are die-hard fundamental traders, you may not want to look at the January soybean weekly chart attached to this blog post. You already know the story of how the contract has fallen, and fallen fast, despite the continued long-term bullish fundamental scenario. You have heard the argument that last Friday’s USDA and WASDE numbers were what upset the apple cart and sent the market reeling. However, from a technical point of view, the market went over the cliff long before those minor adjustments were made to supply and demand tables.
The downtrend in the market began innocently enough as contracts posted new highs in early September. The January weekly bean chart shows a high of $17.81 1/2, followed by a week of consolidation before the contract stepped through the trapdoor. The only technical pattern that appears on this chart indicating a top was the after the fact move to a new four-week low, taking out the previous mark of $16.33 late in the week.
Weekly stochastics (second study) show the market had been overbought for quite some time and had actually established a bearish crossover the week the high in the market was posted (the September 2 blog post “No Clear Turn Signals in Beans” talked about the vulnerability of a coming selloff in the market). Since then only a slight consolidation phase that saw the contract rally from its initial low of $14.84 to a high of $15.77, amounting to a 33% retracement of the first-leg of the downtrend.
P[L1] D[0x0] M[300x250] OOP[F] ADUNIT[] T[]
Looking ahead, what can we gather from the ongoing selloff? There are a number of different possibilities. To begin with, simple trendline analysis (blue line) shows the market to be nearing support created by linking the lows from the week of December 12, 2011 ($11.26 3/4) and the week of May 29, 2012 ($12.49 1/2). This puts support this week at $13.72 1/4.
Retracement analysis (combined Dow Theory and Fibonacci) gives us price targets of about $13.76 3/4 (61.8% retracement of previous uptrend) to $13.42 3/4 (67% retracement of previous uptrend).
If we use a simple measuring technique, the initial wave down of a possible three-wave (loosely applied Elliott Wave Theory) downtrend began with a move below the double-bottom near $16.93. Initial selling took the contract to a low near $15.06 before the above-mentioned consolidation phase took place. This sideways pattern represents the second wave of the downtrend, and came to an end with the move below $15.29 the week of October 29. The measurement of the first wave was roughly $1.87. Subtracting that from the end of the second wave puts the target price at approximately $13.42, in line with the 67% retracement discussed above.
What’s interesting is that a market with as bullish a forward curve (series of futures spreads, not shown) as soybeans doesn’t usually see much more than a 50% retracement. This means there is something other than fundamentals at play in this selloff.
Take note of the last study, a histogram that shows weekly CFTC Commitments of Traders noncommercial long positions in soybean futures. This position has dropped almost 102,000 contracts since mid-July, and is expected to see another substantial reduction in this week’s report. We don’t know when or why this group may change its mind and start to buy, but given how sharply oversold the market is measured by weekly stochastics (middle study), we could see a bullish momentum shift (indicated by a bullish crossover in stochastics with the faster moving blue line moving above the slower moving red line) in conjunction with the latest test of technical price support.
To track my thoughts on the markets throughout the day, follow me on Twitter: www.twitter.com\DarinNewsom
Comments
To comment, please Log In or Join our Community .