

Fundamentally Speaking
Week 33 Corn Ratings
The USDA and public crop tours have confirmed what most everyone has known for a while which is the 2015 U.S. corn crop is quite good in much of the Western Corn Belt while faring less favorably in eastern areas.
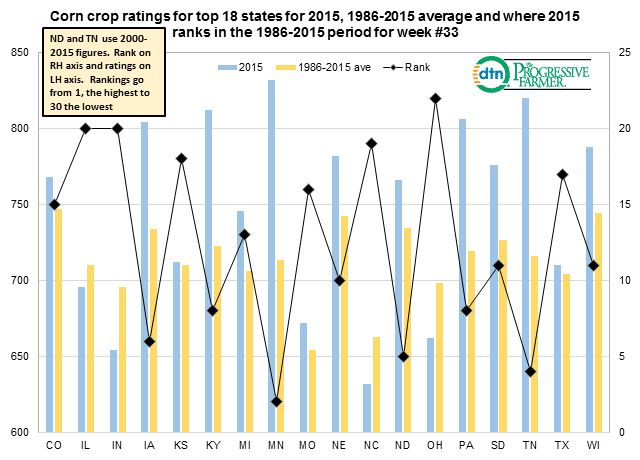
This piece tracks relative crop ratings for the top 18 producing states for week 33 which is usually around the middle of August.
Using our usual ratings system (where we weight the crop based on the percent in each category and assign that category a factor of 2 for very poor, 4 for poor, 6 for fair, 8 for good, and 10 for excellent) and then sum the results the week 33 figure is calculated and also the 1986-2015 average with the exception of North Dakota and Tennessee where the 2000-2015 average is used.
P[L1] D[0x0] M[300x250] OOP[F] ADUNIT[] T[]
We also rank each state to see how this year's ratings compare with past week 33 ratings with a number 1 signifying this is the best week 33 rating since the USDA started the weekly crop condition report in 1986, while a ranking of 30 would mean it has the worst week 33 rating.
The highest rating is in MN where the 832 rating is the second highest ever for this time of year trailing only the 2010 week 33 rating.
The states of IA, ND and TN also have very high ratings.
The state faring the worst IN and OH with current ratings of 696 and 699 respectively with the IN rating 20th out of 33 and the OH rating 22.
The fact that 14 of the 18 states have week 33 ratings above their 1986-2015 average also attests to the generally good corn crop that has been forecasted by the USDA.
(KA)
© Copyright 2015 DTN/The Progressive Farmer. All rights reserved.

Comments
To comment, please Log In or Join our Community .