

Fundamentally Speaking
5, 15 and 25 year acreage trends for corn

Counting down to the kickoff of the 2015 U.S row crop growing season, the first real input will be the release of the USDA's Prospective Plantings report the end of this month.
Based on the current soybean-corn ratio, university studies showing soybeans as a more profitable option for farmers than corn on a prospective net return per acre basis and the fact that certain costs such as land rentals, seeds and fertilizers have not declined to the same degree as crop prices, has many in the trade looking for a 1-2 million decline in U.S. corn area seeded this year with a concomitant rise in soybean plantings.
Still, we thought it may be interesting to look at corn acreage trends over the past number of years to project what 2015 planted area may be for the top producing states and the U.S. as a whole.
P[L1] D[0x0] M[300x250] OOP[F] ADUNIT[] T[]
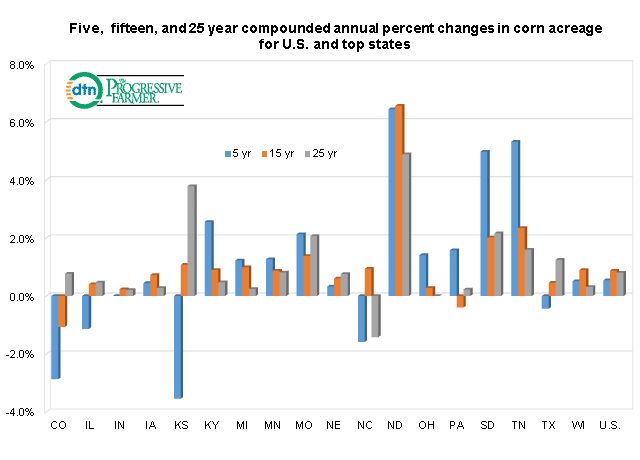
This graphic shows the five, fifteen, and twenty-five year compounded annual growth rates (CAGR) of corn planted acreage in the top 18 producing states and the U.S.
In prior posts we have talked about the increase in corn and soybean acreage in areas of the Upper Midwest and Northern Plains as recent years of high prices and higher yielding short-season varieties have boosted acreage especially in the Dakotas.
We see that corn area has also expanded quite dramatically in the mid-South states of KY and TN. Extrapolating 2015 acreage from the CAGR figures would imply U.S. corn seedings this year anywhere from 91.09 to 91.39 million acres.
We also found that over the past 5, 15, and 25 years the total acreage planted from the top 18 producing states has been a very consistent 92% of total U.S. planted area.
Extrapolating each of the 18 states acreage trends for 5, 15 and 25 years and summing the results and then dividing by 92%, results in U.S. corn acreage for 2015 are anywhere from 91.48 to 91.67 million acres.
(KA)
© Copyright 2015 DTN/The Progressive Farmer. All rights reserved.
Comments
To comment, please Log In or Join our Community .