

Fundamentally Speaking
Wheat Export Sales and Shipment History

Despite falling prices, overseas sales of U.S. wheat remain rather sluggish, depressed by abundant and cheaper foreign supplies and the bearish impact of an appreciating U.S. dollar.
The last export projection furnished by the USDA in their February WASDE report was 900 million bushels which, if that comes to pass, would be tied for the third lowest amount of wheat exports in at least 25 years.
P[L1] D[0x0] M[300x250] OOP[F] ADUNIT[] T[]
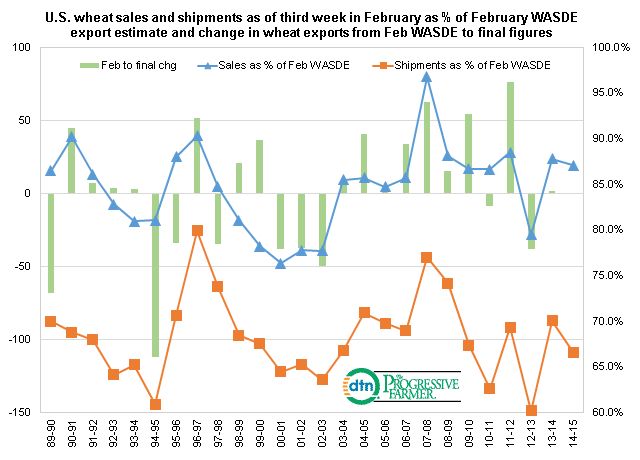
This graphic shows U.S. wheat sales and shipments, 784 million and 600 million bushels respectively for the 2014/15 season, as of the third week of February as a percent of the USDA February WASDE export projection.
The 87.1% sold pace is just about equal to the ten year average of 87.0% while the current shipping pace of 66.6% is slightly below the ten year average of 69.0%.
The end of the wheat marketing year is May 31st so the USDA usually does not have too many adjustments in its export projection from now till then.
Plotted on the left hand axis is the change in the USDA's export projection in million bushels from the February WASDE to the final figure with the ten year average a slight 24 million bushel increase.
Last year by the third week of September the USDA had sold 87.8% of the February WASDE projection of 1.175 billion bushels and the final figure was a mere one million bushels higher, essentially no change.
(KA)
Comments
To comment, please Log In or Join our Community .