

Fundamentally Speaking
Acreage Changes from Outlook to Prospective Plantings Report
At their recently concluded annual Agricultural Outlook forum, USDA economists estimated 2015 U.S corn plantings at 89.0 million acres, soybeans at 83.5 million and all wheat planted area at 55.5 million.
These estimates are made weeks before planting starts and have the assumption of normal weather.
At first blush the figures seem in line with the exception of soybeans where the trade is more inclined to go with an increase in acreage closer to 2.0 million as opposed to the 0.20 million acre reduction from the final 2014 area.
P[L1] D[0x0] M[300x250] OOP[F] ADUNIT[] T[]
A truer assessment of seedings will come at the end of March when the USDA releases its Prospective Plantings report.
This is a survey conducted the first two weeks of March that queries over 84,000 farm operators about which crop or crops they intend to plant.
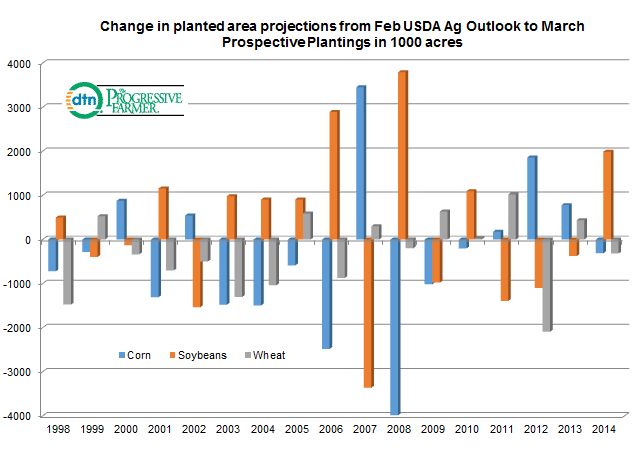
This graphic tracks the difference between the USDA's first guess on how much of the three main crops -- corn, soybeans and all wheat -- farmers will plant to the prospective planting figures given at the end of March in 1000 acres.
Last year the corn difference was an intentions figure 309,000 acres below the Outlook number for corn, an increase of 1.993 million acres of soybeans over the Outlook estimate and a 315,000 acre shortfall of the intentions under the Outlook number for wheat.
For the numbers we have compiled since 1998, the end of March intentions figure has averaged 0.362 million below the February Ag Outlook estimate for corn, a 0.293 million increase for soybeans a 0.310 million acre shortfall for wheat.
The standard deviation between the Feb Outlook numbers and the March intentions is much greater for corn and soybeans since the USDA has a head start with the release of the winter wheat seedings report in January with that class of wheat accounting on average for 70-72% of total wheat acreage over the past number of years.
(KA)

Comments
To comment, please Log In or Join our Community .